Neo4j Dashboard
Neo4j cluster monitoring dashboard, with Prometheus data source. Read more at https://graphaware.com/neo4j/2019/06/11/monitoring-neo4j-prometheus.html
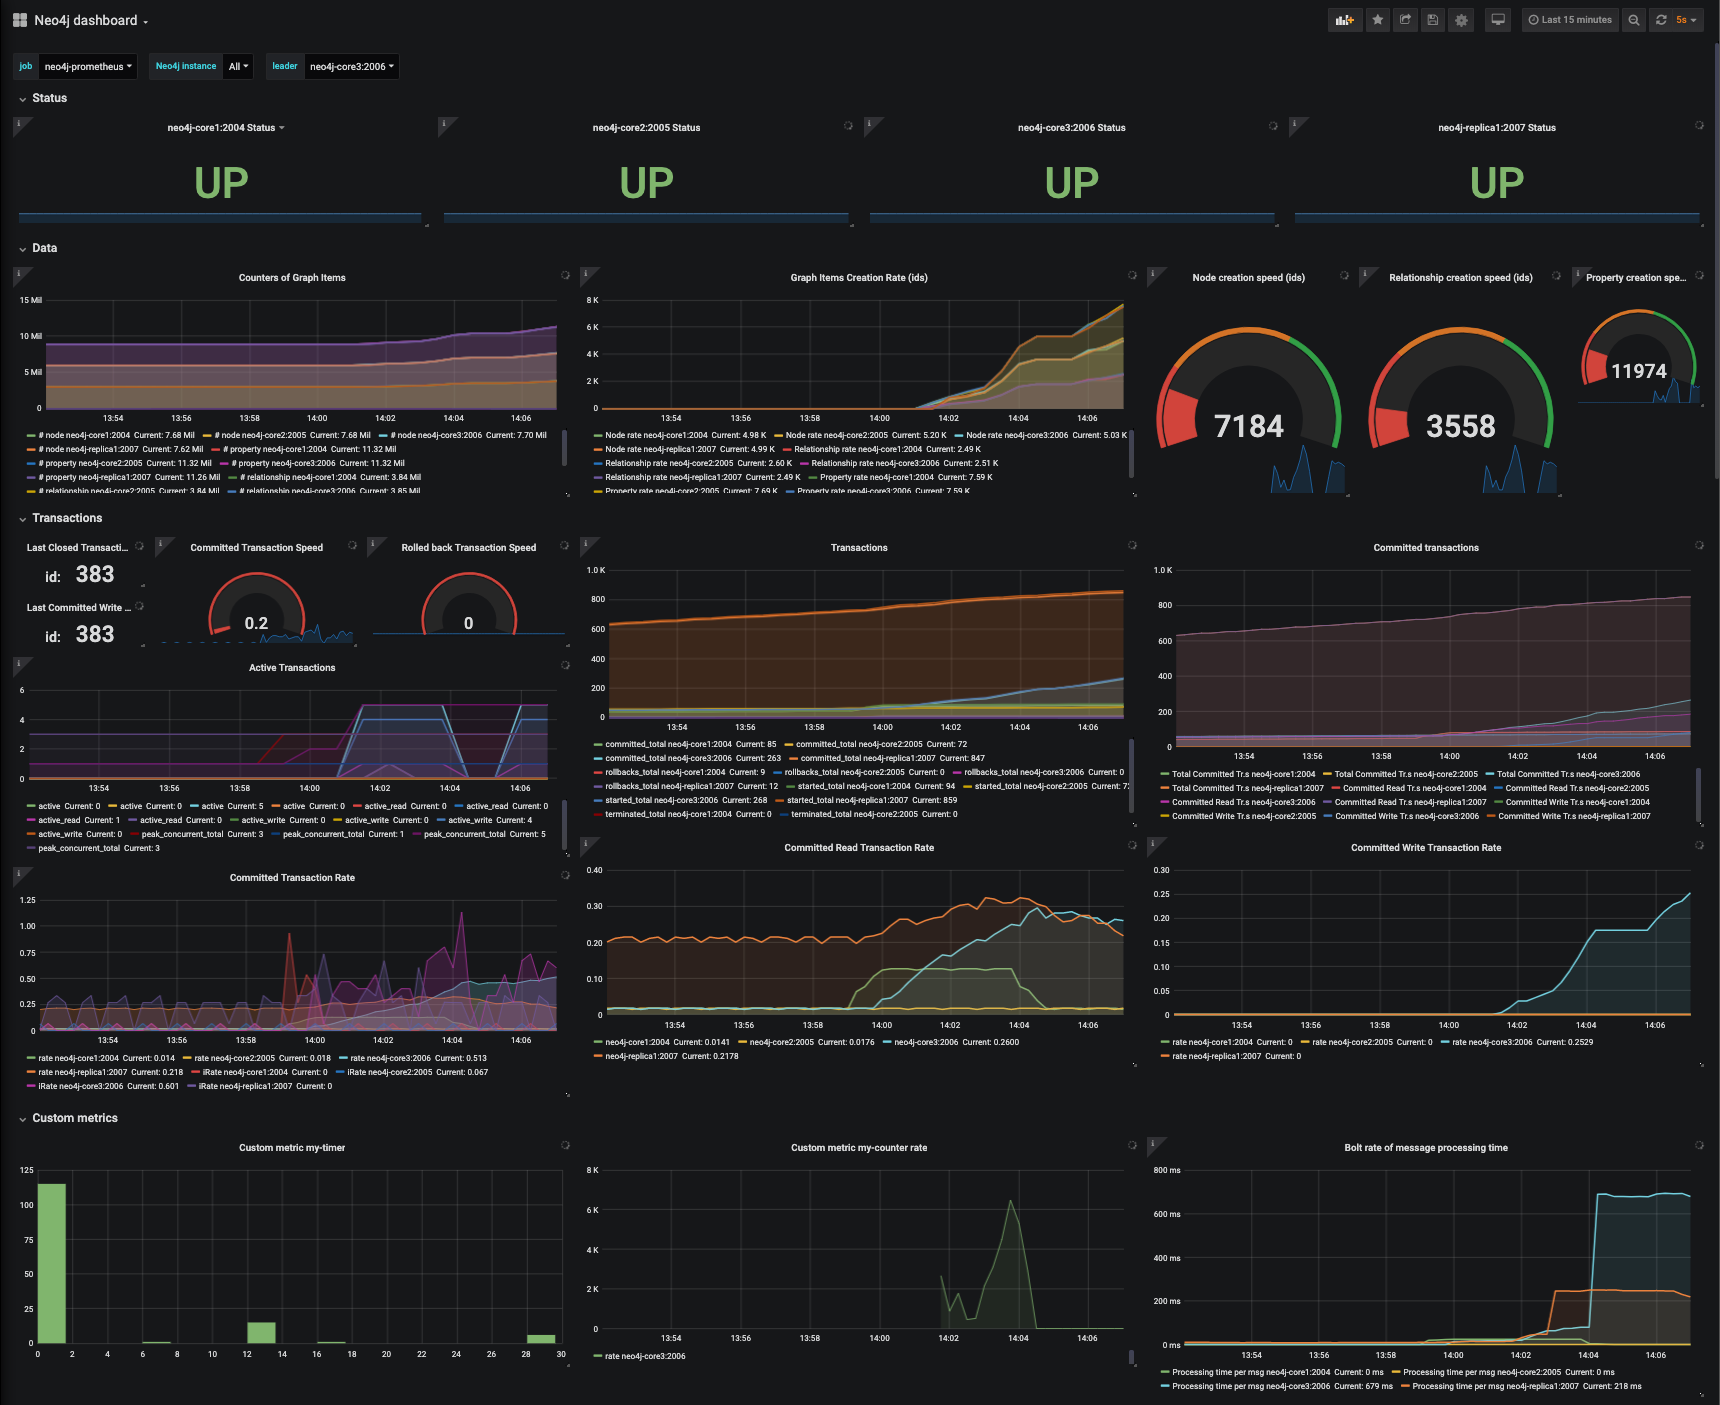
This is an example dashboard for monitoring a Neo4j causal cluster with Prometheus and Grafana.
For a full tutorial please read Monitoring Neo4j and Procedures with Prometheus and Grafana on GraphAware blog.
In that short series we cover
- how to expose Neo4j metrics to Prometheus
- how to create custom metrics in your Neo4j Procedure (with example code)
- how to create a complete Neo4j dashboard with Grafana (with many Neo4j specific examples, also for causal cluster setup)
- how to quickstart Neo4j monitoring with a docker-compose project
Data source config
Collector type:
Collector plugins:
Collector config:
Revisions
Upload an updated version of an exported dashboard.json file from Grafana
| Revision | Description | Created | |
|---|---|---|---|
| Download |