License to observe: Why observability solutions need agents
Note: The original version of this blog post published on ;login: on February 24, 2025.
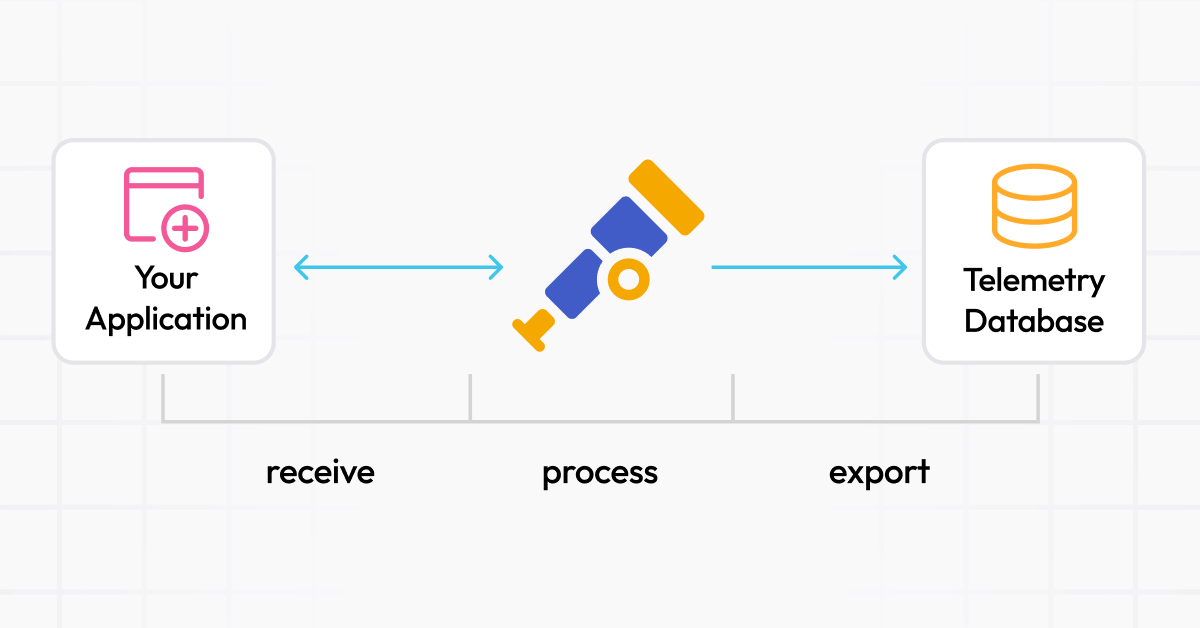
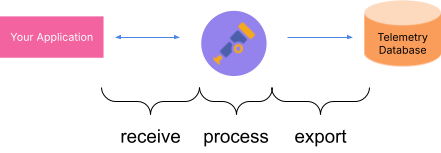
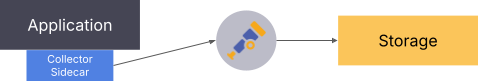
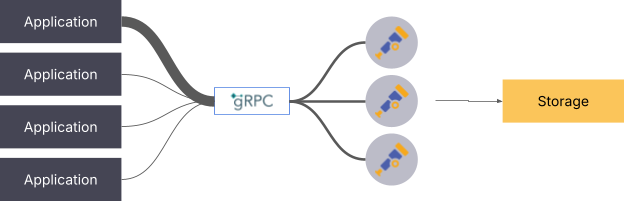
When architecting the flow of observability data such as logs, metrics, traces or profiles, you’ve likely noticed that most solutions ask you to deploy an agent or collector. Understandably, you might be hesitant to deploy yet another application just so you can get your data into your storage system of choice. In most cases, the target architecture looks something like this:

While this illustrates where the collector comes into play, it fails to address why it is needed in the first place. Can we not just send data to the storage? Let’s take a look.
Just send it!
Sending your application telemetry directly to the database is the simplest pattern. It gives developers the power to rapidly test out new configurations and SDKs, but does not require additional infrastructure — what’s not to love?
Well, there are a couple of things to consider. The first issue is vendor lock-in. Even though OpenTelemetry has made great strides in becoming a popular standard for observability data, a plethora of competing protocols and SDKs still have valid use cases. With this approach, however, changing the database requires application developers to adapt every application to effectively communicate with the new backend. Reconfiguring the telemetry endpoints will require an application redeployment. Want to rotate credentials? That’s a restart as well. If the storage backend goes down, that’s another edge case for you to handle.
Another drawback is the limited enrichment capability. If you want your telemetry to contain information about where your application is running, you’ll need to implement this yourself. This either means adding redundant configuration fields or exposing potentially sensitive scheduling APIs to the application — a great way for an attacker to move around your system.
Let the storage pull telemetry

This approach is mostly based on Prometheus. If you’ve used Prometheus, you know how it turns the data flow upside down; instead of sending your telemetry data to Prometheus, it will scrape metrics from your application. This allows for easy switching of the backend, as the application doesn’t need to know anything about the specifics. As the database needs to know where the application is running, this is also a good way to enrich metrics with information about the way the application is deployed.
Pulling telemetry is not a silver bullet though. Enrichment is usually limited to simple mapping of discovery values and, most importantly, this pattern is very tailored to metrics. Depending on the nature of the application, instances might be too short-lived, like function-as-a-service invocations or batch jobs, for the scraper to find them.
The best of both worlds

By adding a collector or agent between your application and storage, this component can then pull or receive data, enrich it, and send it off to the database. It also completely decouples the application from the storage backend, allowing for seamless transition or reconfiguration without downtime.
This post focuses on distributions of the OpenTelemetry Collector. The upstream opentelemetry-collector is very minimal with only a small number of components, but it is designed to be extensible. This allows users and vendors to build their own versions with a specific set of components and configurations. While the feature sets can differ, the general principles covered in this post hold true for all variants.
What does a collector do?
Collector activities can be summarized as receive → process → export.
At the receiving end, the collector specifies on which endpoints to listen or which applications to scrape, combining the pull and push approach. Data is handed off to the processing stage, where it can be further refined, converted, or aggregated. After that, data is packaged and sent off using an exporter.
Taking a look at an example OpenTelmetry Collector config file, this structure is very explicit:
receivers:
  otlp:
	protocols:
  	grpc:
  	http:
processors:
  batch:
exporters:
  otlp:
	endpoint: storage:4317
service:
  pipelines:
	traces:
 		receivers: [otlp]
  		processors: [batch]
  		exporters: [otlp]
Grafana Alloy — our open source distribution of the OpenTelemetry Collector with built-in Prometheus pipelines and support for metrics, logs, traces, and profiles — follows the same principle, but uses a different syntax, focusing on building pipelines through the linking of objects.
Receivers
At first glance, receivers look very uninteresting, as there isn’t much to consider when just configuring them to receive data. That’s not the only way to configure them, though. Many collectors can also extract data out of other systems. If you have been around the Prometheus ecosystem for some time, the concept of exporters might be familiar to you. They are small applications that talk to a system and export metrics in a way that’s understandable by Prometheus. The thing to note here is that oftentimes the collector supports getting this data directly. Taking a look at opentelemetry-collector-contrib shows receivers for host metrics, Redis, GitHub, and more!
Grafana Alloy also provides many different receivers and allows them to work together seamlessly. It contains an embedded version of Grafana Beyla, enabling simplified auto-instrumentation using eBPF. This is especially useful for situations where you don’t have access to the underlying application source code, but still want to see relevant telemetry data.
Processors
Once data has been received, the collector can then run various processors to enrich, filter, or manipulate the data. Common use cases include:
- Adding/removing/editing attributes (e.g., this data point originates from node XYZ)
- Redacting sensitive information from logs (e.g., replacing IP addresses in logs with a rough geographic area)
- Generating metrics from traces or logs (e.g., log frequency to request rate)
- Sampling traces (e.g., only keep 10% of traces from successful requests)
- Routing based on attributes (e.g., send data to different storages based on teams)
Routing to different exports is a core method used to realize multi-tenancy. Depending on the emitting application, the data can be sent to different storage backends or in different locations.
Processors can also be used to improve performance and latency by batching writes and splitting the write path by separating the receiver from the exporter.
Exporters
Now that everything is processed, the data still needs to get to the backing storage somehow. As with receivers, many different solutions and protocols are supported. By adding authentication information at this layer, developers don’t need to concern themselves with properly authenticating, as long as they send data to the collector. This is especially useful if you need to rotate credentials. Would you rather redeploy all applications, or just the collector? When evaluating new solutions, it is also possible to export the data to multiple locations simultaneously.
How to deploy a collector
With the functionality of collectors covered, it is time to look at how to deploy the collector. Depending on the data you wish to collect, your service architecture, and security requirements, different deployment methods may be more appropriate than others.
Single instance collector
Deploying the collector as a single instance service is the simplest approach. You could deploy one instance per team, namespace, cluster, or region, depending on your scale and separation requirements. Many applications can send to the same collector with the same processing pipelines being applied to all of them. This allows for standardization very early on while still allowing for flexibility on the application developer side.
Collector sidecar
Utilizing a single-purpose collector with each application as a sidecar is common when dealing with legacy applications. For example, if the application writes logs to a specific file on disk, a collector sidecar running alongside the application can watch that file and send the logs using the OpenTelemetry protocol (OTLP) format to another collector down the line. Another example would be an application that exposes metrics on an endpoint that should not be accessible outside the application context. With a collector in the same execution context, this endpoint can remain closed off to other systems while still allowing metrics to be extracted.
Another use case of the sidecar pattern would be as a simple way to scale up. When exceeding the limitations of a single collector, spawning a separate instance for each application can help alleviate resource pressure on a shared instance. These early layers can then do filtering and processing early on, reducing the system requirements for the next layer of collectors.
When rolling out collector sidecars for all applications, you might want to look into a solution like Fleet Management in Grafana Cloud to help manage your fleet of collectors and keep the configuration consistent.
Node collector
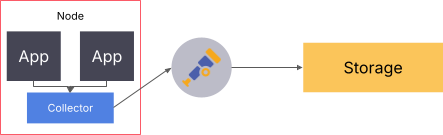
As with the sidecar pattern, deploying one collector per node can help with scalability. This is commonly used with logs. A single node collector scrapes all log files and sources on a node and sends the data off to the storage. This method of deploying can also come in handy when trying to minimize latency between the emitting application and the receiver, which can make a big difference in function-as-a-service environments.
Since the node collector is able to send data to different endpoints based on attributes, this approach can even be used when multiple teams share the same underlying node.
Scaling up
In most cases, having a single replica of the collector is sufficient. In case you outgrow this, there are a few ways to scale the collector.
Push-based signals
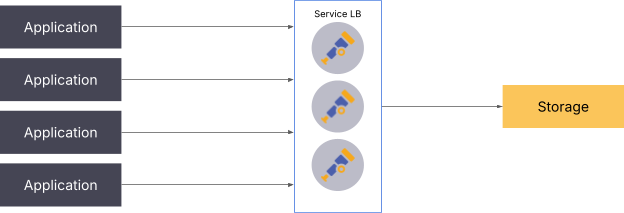
When utilizing push-based signals, the simplest approach to scaling is to load balance the requests made to the collector. Keep in mind that this architecture is still not perfect, as distributing the load on the service layer can still lead to a single producer overloading a specific collector.
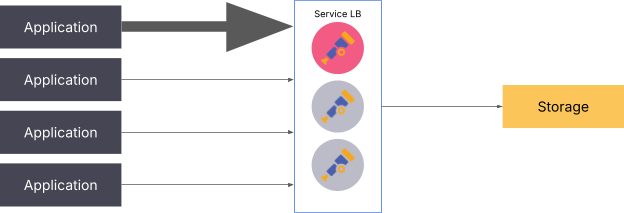
The solution to this issue is to either deploy a gRPC-aware load balancer or add another collector utilizing the load-balancing exporter.
Pull-based signals
For pull-based signals, scaling needs to be done by splitting up the targets between the collectors. This applies to logs as well as traces. For logs, it is usually enough to deploy a single collector per node, but utilizing the sidecar pattern is also a valid approach.
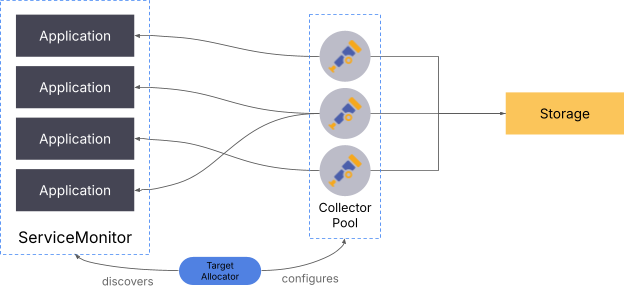
When scaling up pull metrics, the collector instances need to be told which targets to scrape. In the Kubernetes ecosystem, the target allocator takes care of this. It’s an additional component that discovers endpoints and distributes them to a set of collectors.
Using Grafana Alloy, it is possible to scale pull-based metrics without the target allocator. Alloy supports clustering multiple collectors together, which then split the targets dynamically. This is also usable outside of Kubernetes.
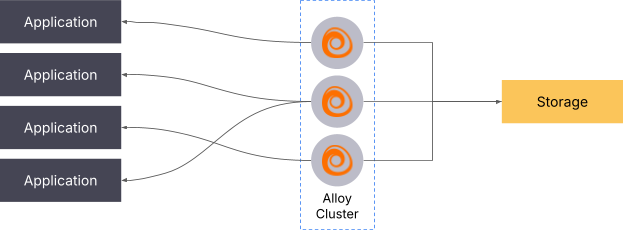
You can learn more about this in the clustering documentation.
Best practices for implementing collectors
As you can see, there are many different ways to set up an effective telemetry pipeline. This flexibility comes at the expense of figuring out what you really want. To counteract this a bit, I’ll leave you with some recommendations to apply when designing your telemetry flow.
Separate telemetry types
Not all telemetry is created equally. An application might produce thousands of logs but only expose a few metrics. The same goes for traces. This also means that different signals scale differently. The good thing is you don’t have to decide on one deployment architecture for everything! A good starting point could be to have one collector per node taking care of logs, while deploying additional collectors per team or application taking care of traces and/or metrics.
Chain collectors
As you might have noticed, some patterns have multiple collectors chained one after another. This allows you to separate concerns between multiple layers of your stack, resulting in smaller and easier-to-digest configurations. This is especially useful if you need centralized observability storage, but are ingesting from multiple teams with different requirements. At each level, information can be added or removed.
Stay consistent
Yes, the collector supports many protocols. This still doesn’t mean you should use all protocols available to you. By standardizing on a single protocol early, you remove the need for conversion and have a common terminology when talking about the data in flow. Ideally, you’ll only have to convert at the last step when sending the data off to your storage backend. Conversions work reasonably well but will introduce additional overhead and complexity since not every mapping is clean.
Instrument early
Think about observability from day one. It’s way easier to start building a well-instrumented application from scratch than grafting on libraries to an existing application. Obviously this is not applicable when tasked with modernizing an existing application, but by planning for observability from the beginning, you’ll help your future self during debugging.
When starting out, focus on traces first. Especially with web applications, traces allow for a very detailed look into your application and can also be converted to logs or metrics down the line (at the storage layer or in a collector directly!).