Grafana 11.6 release: new data visualization features, LBAC for metrics data sources, alerting updates, and more
Our engineering team is hard at work on Grafana 12, the next major release of the open source data visualization platform that we’re launching at GrafanaCON this May, but in the meantime, Grafana 11.6 is officially here — and there’s a lot to be excited about.
The latest minor release delivers a number of new dashboarding features, including one-click data links and actions, along with other notable updates related to security, alerting, and more.
Below are some of the highlights from Grafana 11.6. If you are looking for more details about all the changes in this release, refer to the changelog or the What’s New documentation.

Enhancements to dashboards and visualizations
One-click data links and actions in visualizations
Generally available in all editions of Grafana
When visualizing data in Grafana, data links are a helpful tool to link to other panels, dashboards, and external resources while maintaining the context of your source panel.
Last year, we introduced one-click data links and actions for canvas visualizations in public preview and experimentally, respectively. With the One click switch toggled on, you can open a data link or trigger an action with a single click — and now, both of these features are generally available.
With the promotion to general availability, the One click switch has been moved into the dialog box where you configure the data link or action at the element level.

In addition to canvas, the following visualization types also now support one-click data links:
- Time series
- Bar chart
- Candlestick
- State timeline
- Status history
- Trend
- XY chart
Note: you can only have one one-click data link, so if you enable it for one, the feature is automatically disabled for others.
As of the 11.6 release, actions for the following visualizations are also now GA, allowing you to trigger basic, unauthenticated API calls from a dashboard panel:
- Time series
- Bar chart
- Candlestick
- State timeline
- Status history
- Table
- Trend
- XY chart
You can find actions under the Data links and actions section of the panel editor pane (previously the Data links section).
You can learn more about adding data links and actions in our technical documentation.
New Actions cell type for table visualizations
Generally available in all editions of Grafana
Speaking of actions, the table visualization now includes an Actions cell type, which lets you trigger actions directly from table cells. This enhancement allows you to define custom actions, such as triggering external workflows, right within a table column.
Better time region control in Annotations with Cron syntax
Generally available in all editions of Grafana
Annotations are a way to indicate within data visualizations that certain events took place (think of them like a Post-it note for Grafana!). When you hover over annotations on your visualization, you get an event description and event tags, as well as a text field that can include links to other systems with more detail.
When adding or editing an annotation, you can define a repeating time region by setting Query type to Time regions. Then, you can define the From and To sections with the preferred days of the week and time.
Now, with the Grafana 11.6 release, you can use Cron syntax to define schedules that are much more granular. For example, it is now possible to create a single time region query that marks specific periods, such as “21:00 on the second Tuesday of every other month” or “Weekdays 9-5.”
To try this feature, create an annotation and toggle the Advanced switch on.

You can learn more about adding time regions in our technical docs.
Improved performance in geomap visualizations
Generally available in all editions of Grafana
Geomaps are the go-to Grafana visualization when you have data that includes location information, and you want to see that data displayed on a map. Within geomaps, you can use a feature called a marker layer to display data points as different marker shapes, such as circles, squares, triangles, or stars.
To improve the performance of marker layers in 11.6, we’ve officially moved to the Web Graphics Library (WebGL), a JavaScript API for rendering high-performance interactive 3D and 2D graphics.
This change provides a significant boost in both performance and stability, which is especially noticeable for larger datasets. For example, the following GIFs demonstrate what a 1,000 marker layers would look like before and after switching to WebGL.
Before WebGL:
After WebGL:

To learn more about geomaps, please refer to our technical docs.
Dashboard variables now supported for all transformations
Generally available in all editions of Grafana
Variables help you make your Grafana dashboards more dynamic, allowing you to filter and search for the data you care about most, without having to edit queries. Meanwhile, transformations are another helpful feature in Grafana that enable you to manipulate data returned by a query before applying a visualization.
In previous releases, we added support for dashboard variables to a small number of transformations. Now this functionality has been added to all transformations where variables can be used.
All text input fields in transformations accept variable syntax:
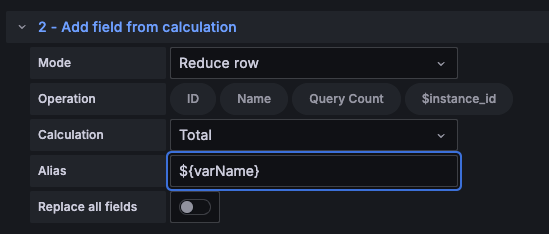
When you use dashboard variables in transformations, the variables are automatically interpolated before the transformations are applied to the data.
To read more, please check out our documentation.
Security, access, and authentication updates
LBAC for metrics data sources
Experimental in all editions of Grafana
We know it can be difficult for teams to collaborate on dashboards when they use a lot of different data sources. To help address this, we’re rolling out Label Based Access Control (LBAC) for metrics data sources, meaning data sources that are created using Grafana Mimir.

This feature allows fine-grained access control to data sources by filtering metrics based on labels. It lets administrators configure access rules for teams, ensuring users only query data relevant to their assigned label permissions.
Feature highlights include:
- The ability for teams to view queries to the same data source with different LBAC rules applied
- Configuration using the API and the UI
- Simplified LBAC notation is automatically converted into correct custom headers
We also recommend the following best practices when using this feature:
- Only add query permissions for teams that will have LBAC rules and remove default
ViewerandEditorquery permissions. - As an initial setup, define as few rules as possible for each team, making sure they’re additive rather than negating one another.
- For validating rules, test each rule in Explore view. This allows you to see the metrics that would be returned for the specific rule.
To learn more about this feature, please check out our technical docs.
API keys fully deprecated and automatically migrated to Service Accounts
We’ve fully deprecated API keys in Grafana, and all existing API keys have been automatically migrated to service accounts. No worries; no action is needed on your part. Your API integrations will continue to work seamlessly while benefiting from improved security and management features.
Migrating API keys to service accounts actually offers several benefits, including:
- Role-Based Access Control (RBAC): Assign roles (for example, Viewer, Editor, or Admin) and scope access to specific teams for improved security.
- Audited automation: Service accounts are integrated with Grafana’s identity management system, ensuring all actions are logged for better tracking and compliance.
- Seamless token rotation: Manage multiple tokens per service account effortlessly, allowing for smooth rotation without downtime.
To learn more, please refer to this blog post and to our docs.
Standardized links for Grafana plugins
Public preview in all editions of Grafana
We’re excited to share a big improvement to the Grafana plugin catalog that benefits both Grafana users and plugin developers: the introduction of standardized links on plugin details pages.
This change makes it easier for users to engage with developers and find the essential information they need to get the most out of a plugin. Developers, in turn, will gain more valuable feedback and support from the community.
Previously, plugin details pages in the Grafana catalog relied on custom links provided by developers, leading to inconsistencies in information being available. These are still configurable, but are now augmented with standard links for key elements, such as raising an issue or navigating to the source code repository if the plugin is open source.
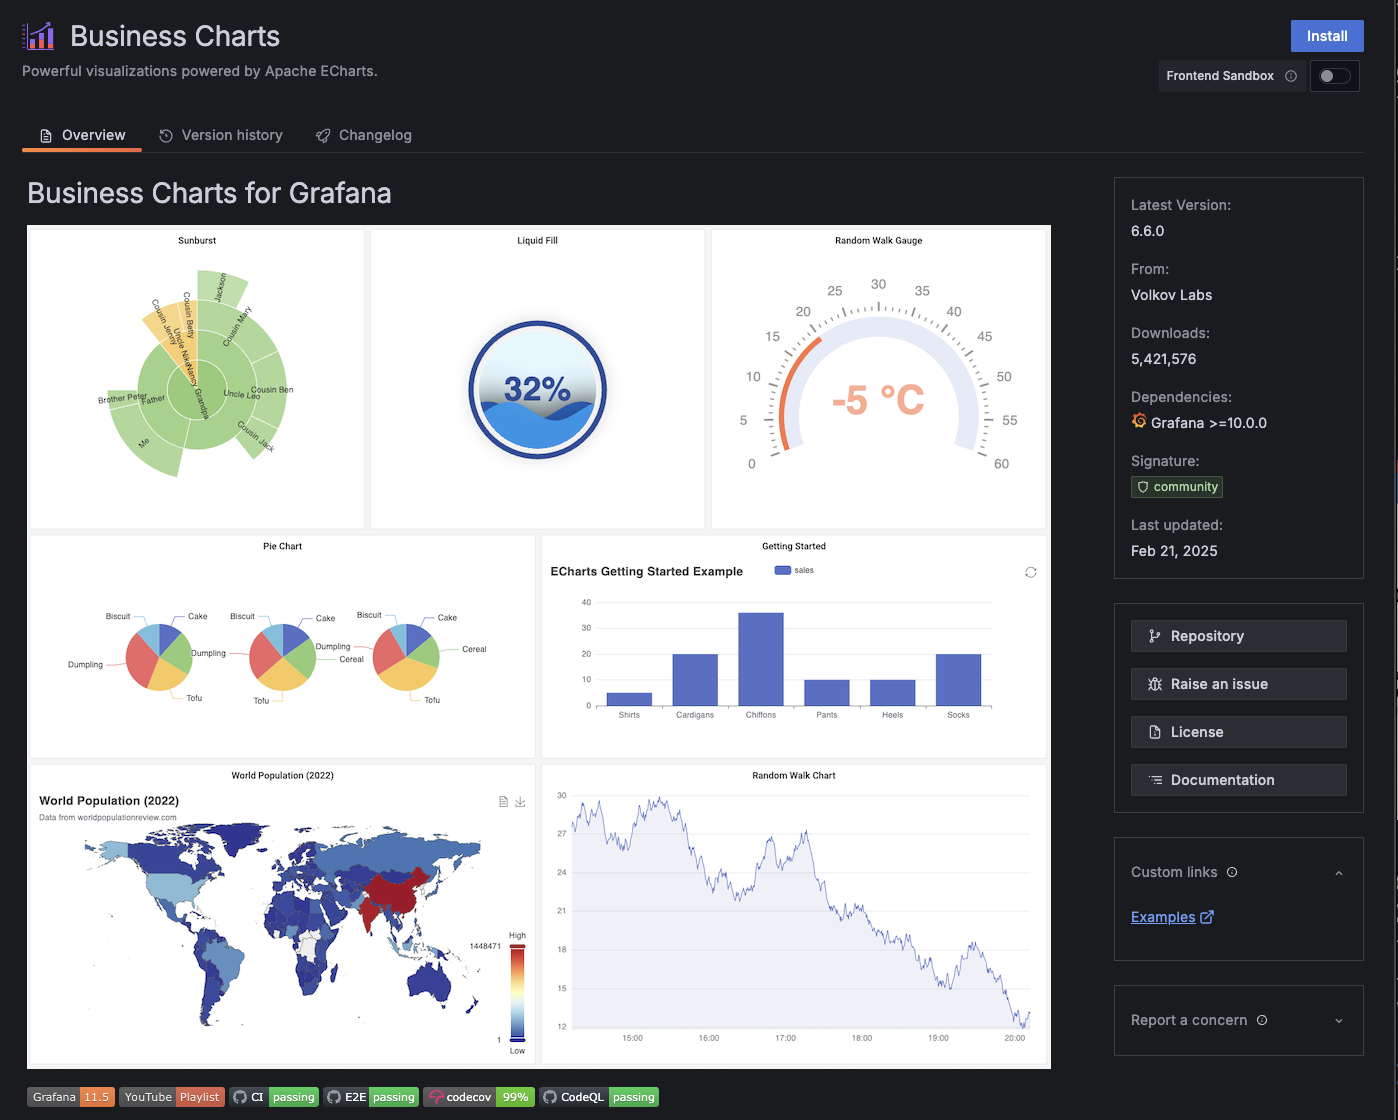
We recommend plugin developers check the inferred links by viewing their plugin in the catalog. To read more, please reference our documentation.
New alerting features
Generally available in all editions of Grafana
Lastly, Grafana 11.6 includes the following new features for Grafana Alerting:
- Support for Jira Service Management contact point: In response to the recent deprecation of OpsGenie, Grafana Alerting now supports Jira Service Management as a Grafana-managed contact point. You can ensure you don’t miss any critical alerts by updating your OpsGenie contact points to use Jira Service Management.
- Alert rule version history: Grafana-managed alerts now support version history. Simply navigate to the Alert details view of any Grafana-managed alert rule and click the Version tab to view, compare, and restore your alert’s historical versions.
Learn more about Grafana
For an in-depth list of all the new features in Grafana, check out our Grafana documentation, the Grafana changelog, or our What’s New documentation.
Join the Grafana Labs community
We invite you to engage with the Grafana Labs community forums. Share your experiences with the new features, discuss best practices, and explore creative ways to integrate these updates into your workflows. Your insights and use cases are invaluable in enriching the Grafana ecosystem.
Upgrade to Grafana 11.6
Download Grafana 11.6 today or experience all the latest features by signing up for Grafana Cloud, which offers an actually useful forever-free tier and plans for every use case. Sign up for a free Grafana Cloud account today.
Our Grafana upgrade guide also provides step-by-step instructions for those looking to upgrade from an earlier version to ensure a smooth transition.
A special thanks to our community
We extend our heartfelt gratitude to the Grafana community!
Your contributions, ranging from pull requests to valuable feedback, are crucial in continually enhancing Grafana. And your enthusiasm and dedication inspire us at Grafana Labs to persistently innovate and elevate the Grafana platform.
Grafana Cloud is the easiest way to get started with metrics, logs, traces, dashboards, and more. We have a generous forever-free tier and plans for every use case. Sign up for free now!