How to build the ultimate March Madness dashboard in Grafana
March Madness is here! Time for buzzer beaters, Cinderellas, and, of course, brackets. But with all that excitement, the last thing you need is to miss out on a crucial moment because you’re too busy refreshing ESPN for the hundredth time.
Instead, why not build your own real-time March Madness dashboard in Grafana? With live NCAA game data, real-time player stats, and a jumbotron-style scoreboard, you’ll stay on top of all the action—no refresh needed.
In this guide, I’ll walk you through how to create the ultimate tracking experience. You’ll learn how to:
🏀 Pull live game schedules dynamically with a date selector
🏀 Track real-time player stats for selected games
🏀 Design a jumbotron-style scoreboard that looks like it’s straight out of an arena
Let’s tip off!
Getting started: Install the Infinity plugin
To get started, log into your Grafana Cloud account and navigate to the Connections panel. (If you aren’t using Grafana Cloud already, sign up for a forever-free account today!) From there, search for the Infinity plugin and click the corresponding card.
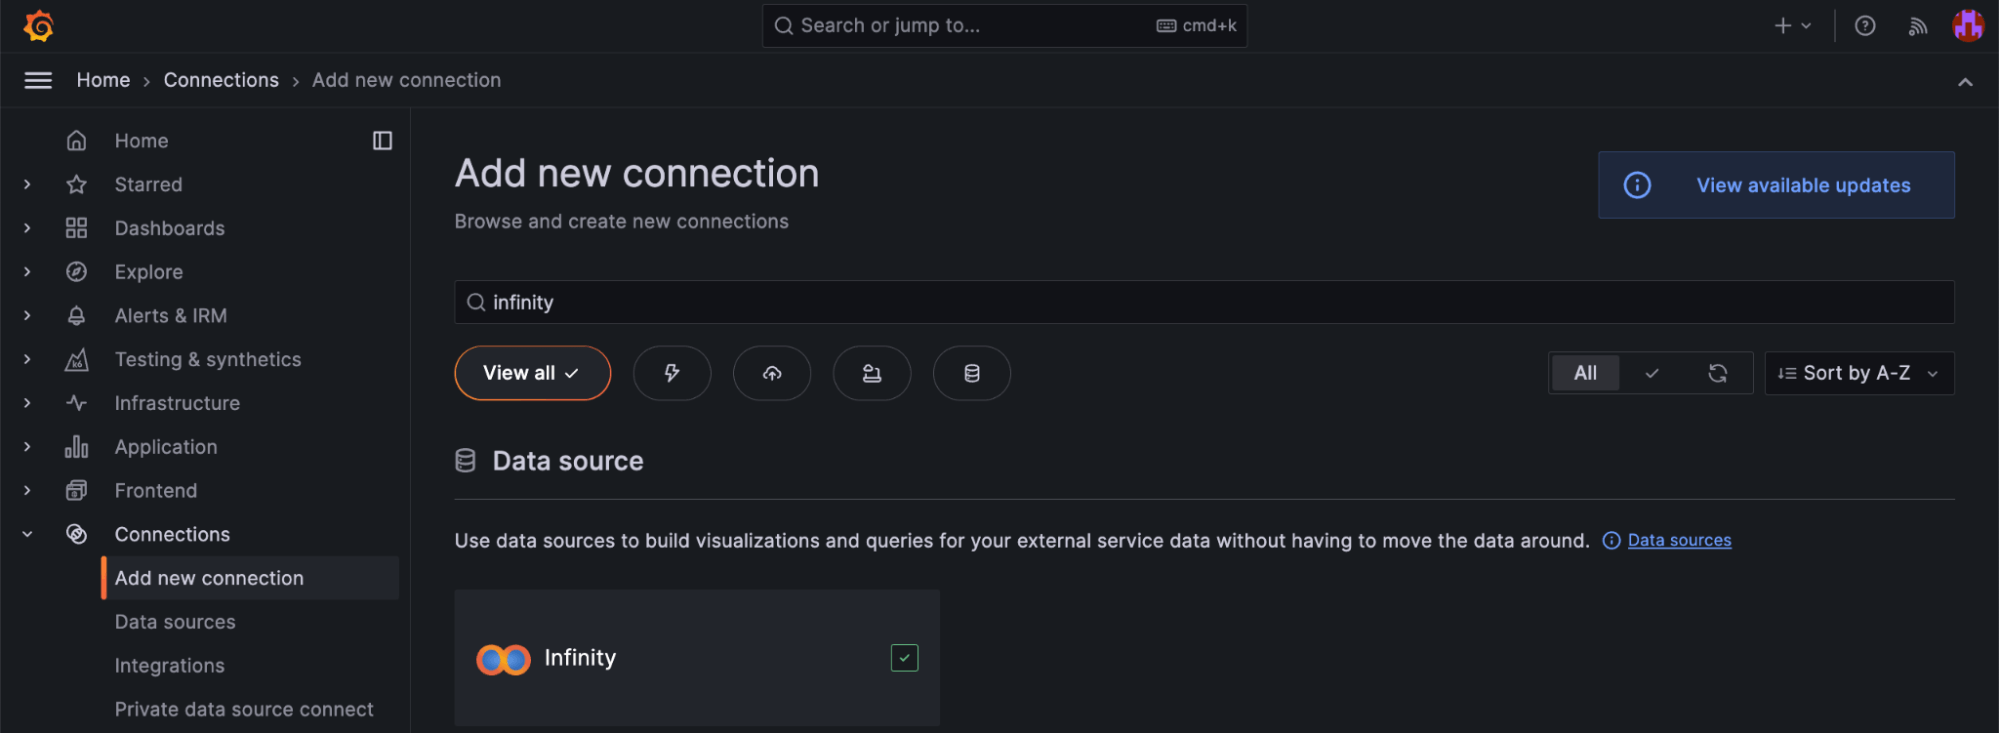
Once installed, create a data source. Unlike many other Grafana plugins, the Infinity data source plugin doesn’t require any configuration at this stage. You can easily perform those configurations later, when you start using the data source, in Explore mode or while editing a dashboard.
Creating our March Madness scoreboard
Now that you have the Infinity data source plugin configured, you can start building our dashboard.
Step 1: Create a date selection variable
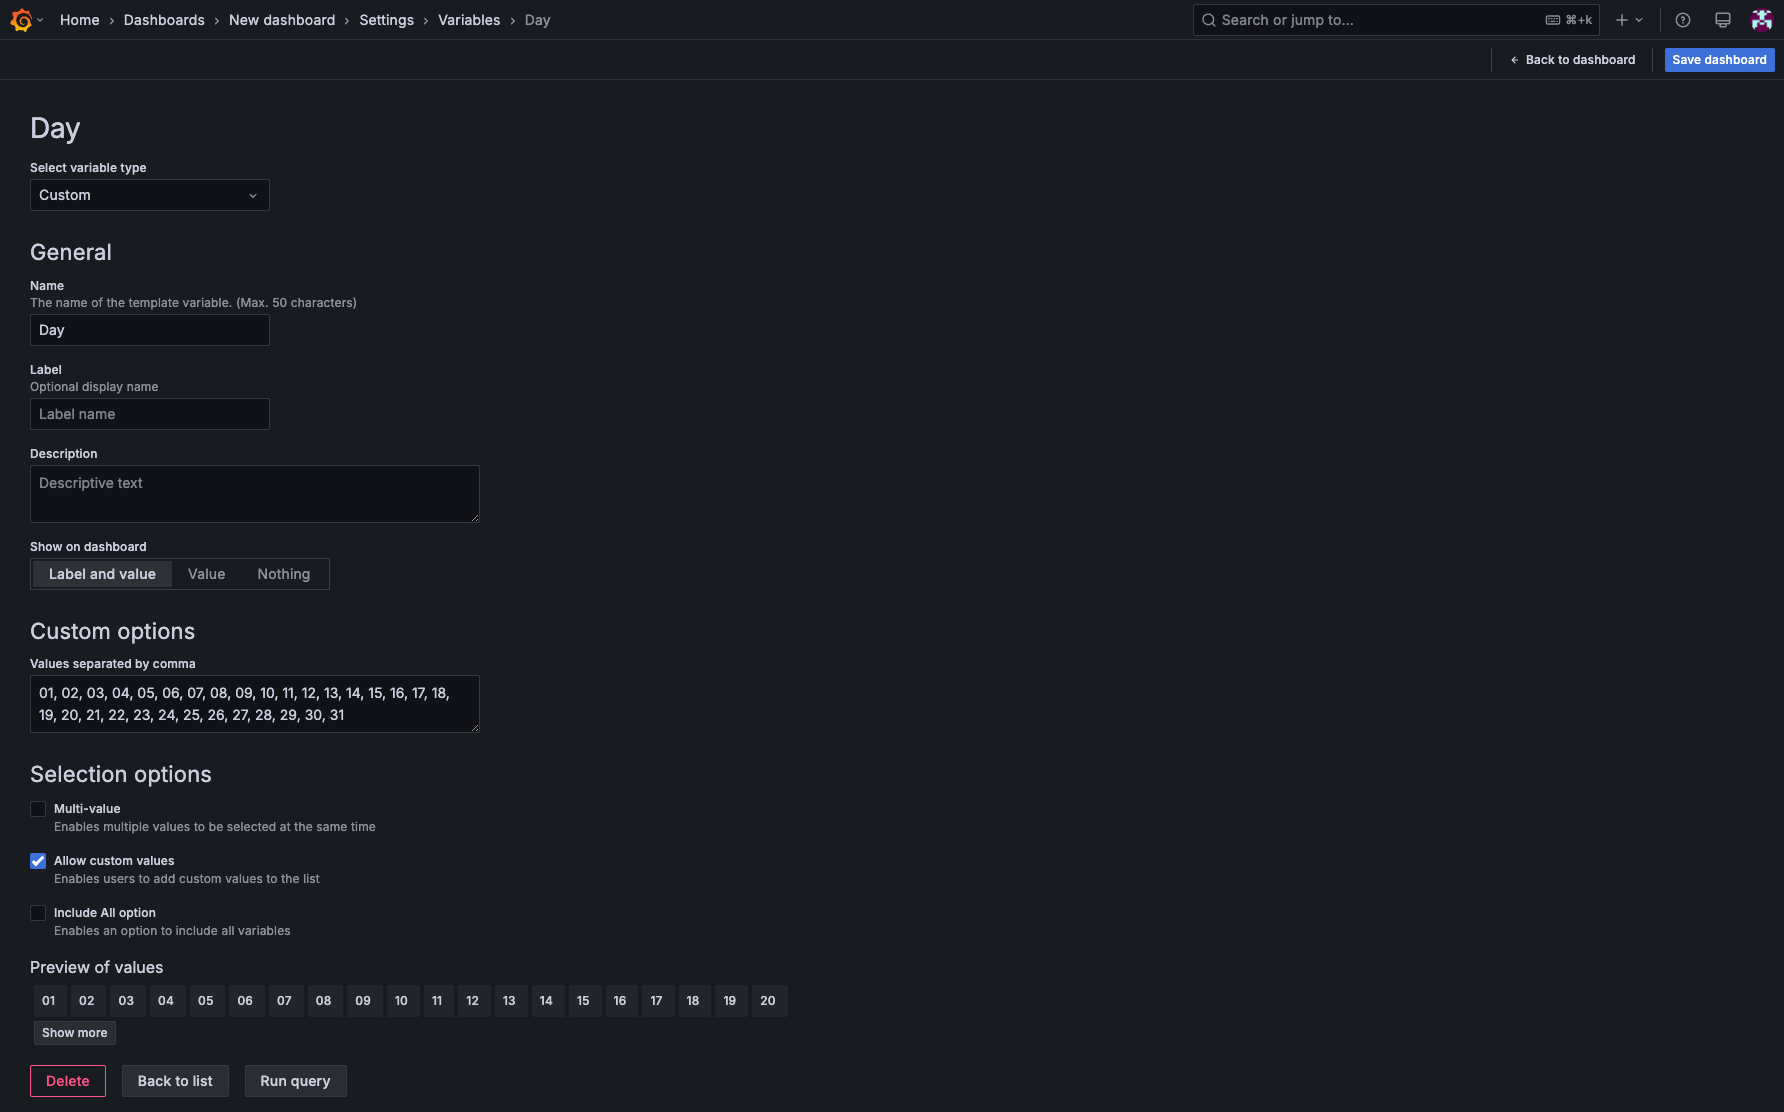
You want your dashboard to dynamically pull game schedules, so let’s create date selection variables for “Month” and “Day.”
To create the variables:
- Go to Dashboard Settings > Variables.
- Click Add Variable.
- Configure:
- Type:
Custom - Name:
Day - Values:
01,02,03,...,31
- Type:
- Click Save.
Repeat the process for Month (Values: 01-12).
This allows users to select a date from the dropdown and fetch the schedule dynamically!
Step 2: Fetch live NCAA game data with Infinity plugin
You’ll now configure the Infinity Plugin to fetch real-time NCAA game data for the selected date.
- Create a new panel by clicking Add visualization.
- Select the Infinity plugin as your data source.
- Change the URL to your JSON, which can be pulled from the NCAA website, and by adding in your date variables from Step 1:
https://data.ncaa.com/casablanca/scoreboard/basketball-men/d1/2025/${Month}/${Day}/scoreboard.json
- Change the visualization of the panel to a table.
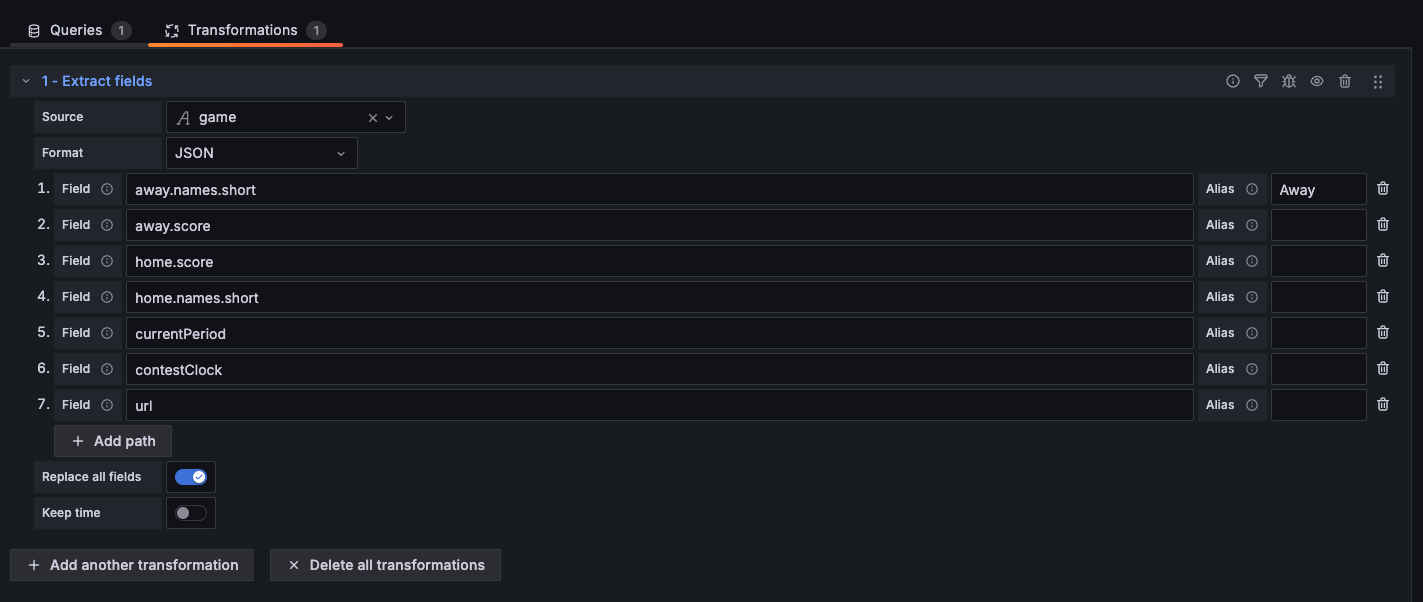
- Add a new transformation to extract the fields you need to display:
- Extract fields
- Source:
game - Format:
JSON - Add path:
away.names.shortaway.scorehome.scorehome.names.shortcurrentPeriodcontestClockurl
- Source:
- Extract fields
- Change the alias to your chosen column names.
- Toggle on “Replace all fields.”
Now, whenever you change the date in your variables, the game schedule updates automatically!
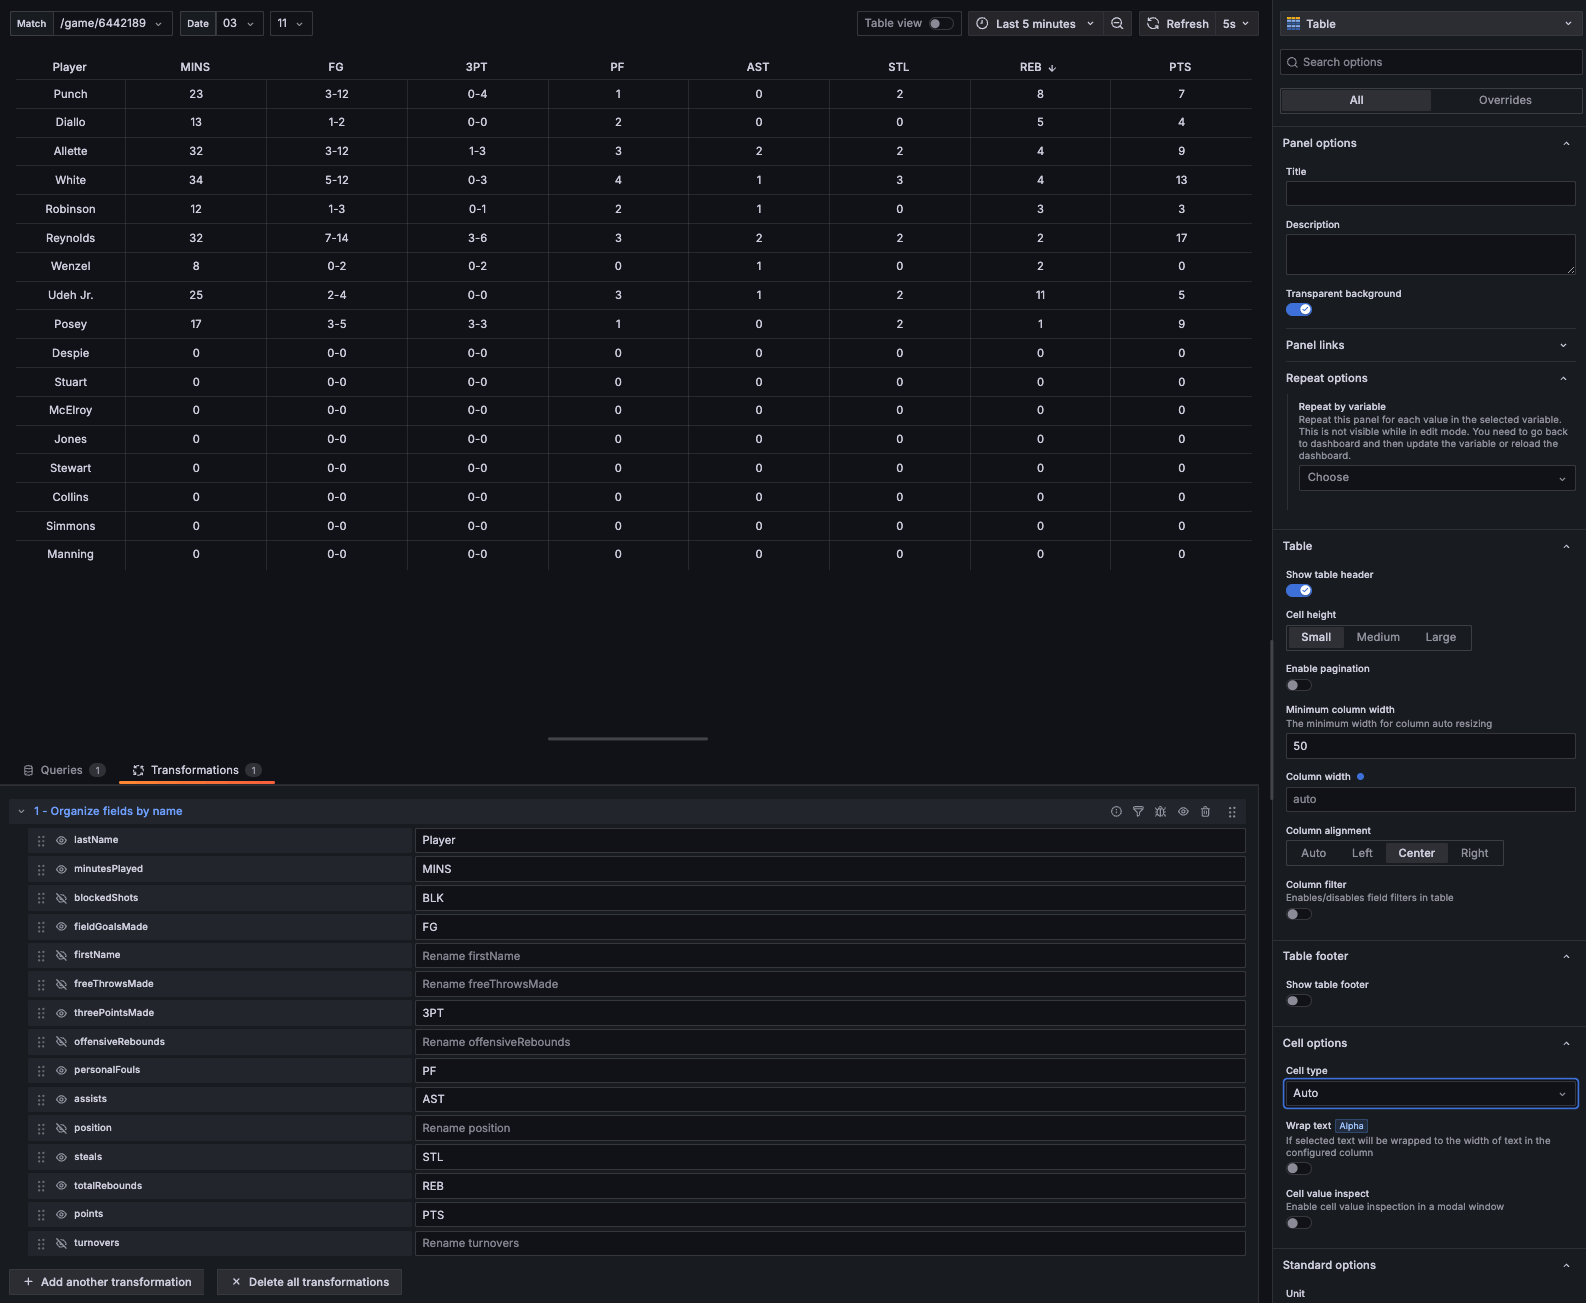
Step 3: Pull player stats for the selected game
Now that you’ve created your scoreboard, you can create a panel that displays the player stats for your selected game. The API returns detailed player statistics such as:
- Points scored
- Assists
- Rebounds
- Turnovers
- Minutes played
First, you’ll need to create a new variable to fetch box score data in Grafana.
- Go to Dashboard Settings > Variables.
- Click Add Variable.
- Configure:
- Type:
Textbox - Name:
GameID
- Type:
- Click Save.
- Add in the game ID from the URL column in your game schedule panel
- Example: /game/6442188
Next, configure the Infinity plugin to fetch real-time player game data for the selected game.
- Create a new panel by clicking Add visualization.
- Select your Infinity data source.
- Change the URL to your JSON, which can be pulled from the NCAA website, and by adding in your
GameIDvariable from above:- URL: https://data.ncaa.com/casablanca/$GameID/boxscore.json
Rows/Roots: $.teams\[1].playerStatsRows/Roots: $.teams\[0].playerStats
- Change the panel visualization to a table.
- Add a new transformation to organize the fields you need to display:
- Organize fields by name
- Change the order
- Label the columns
- Hide the stat columns you don’t want to see
- Organize fields by name
Now, select a date and game—player stats update instantly!
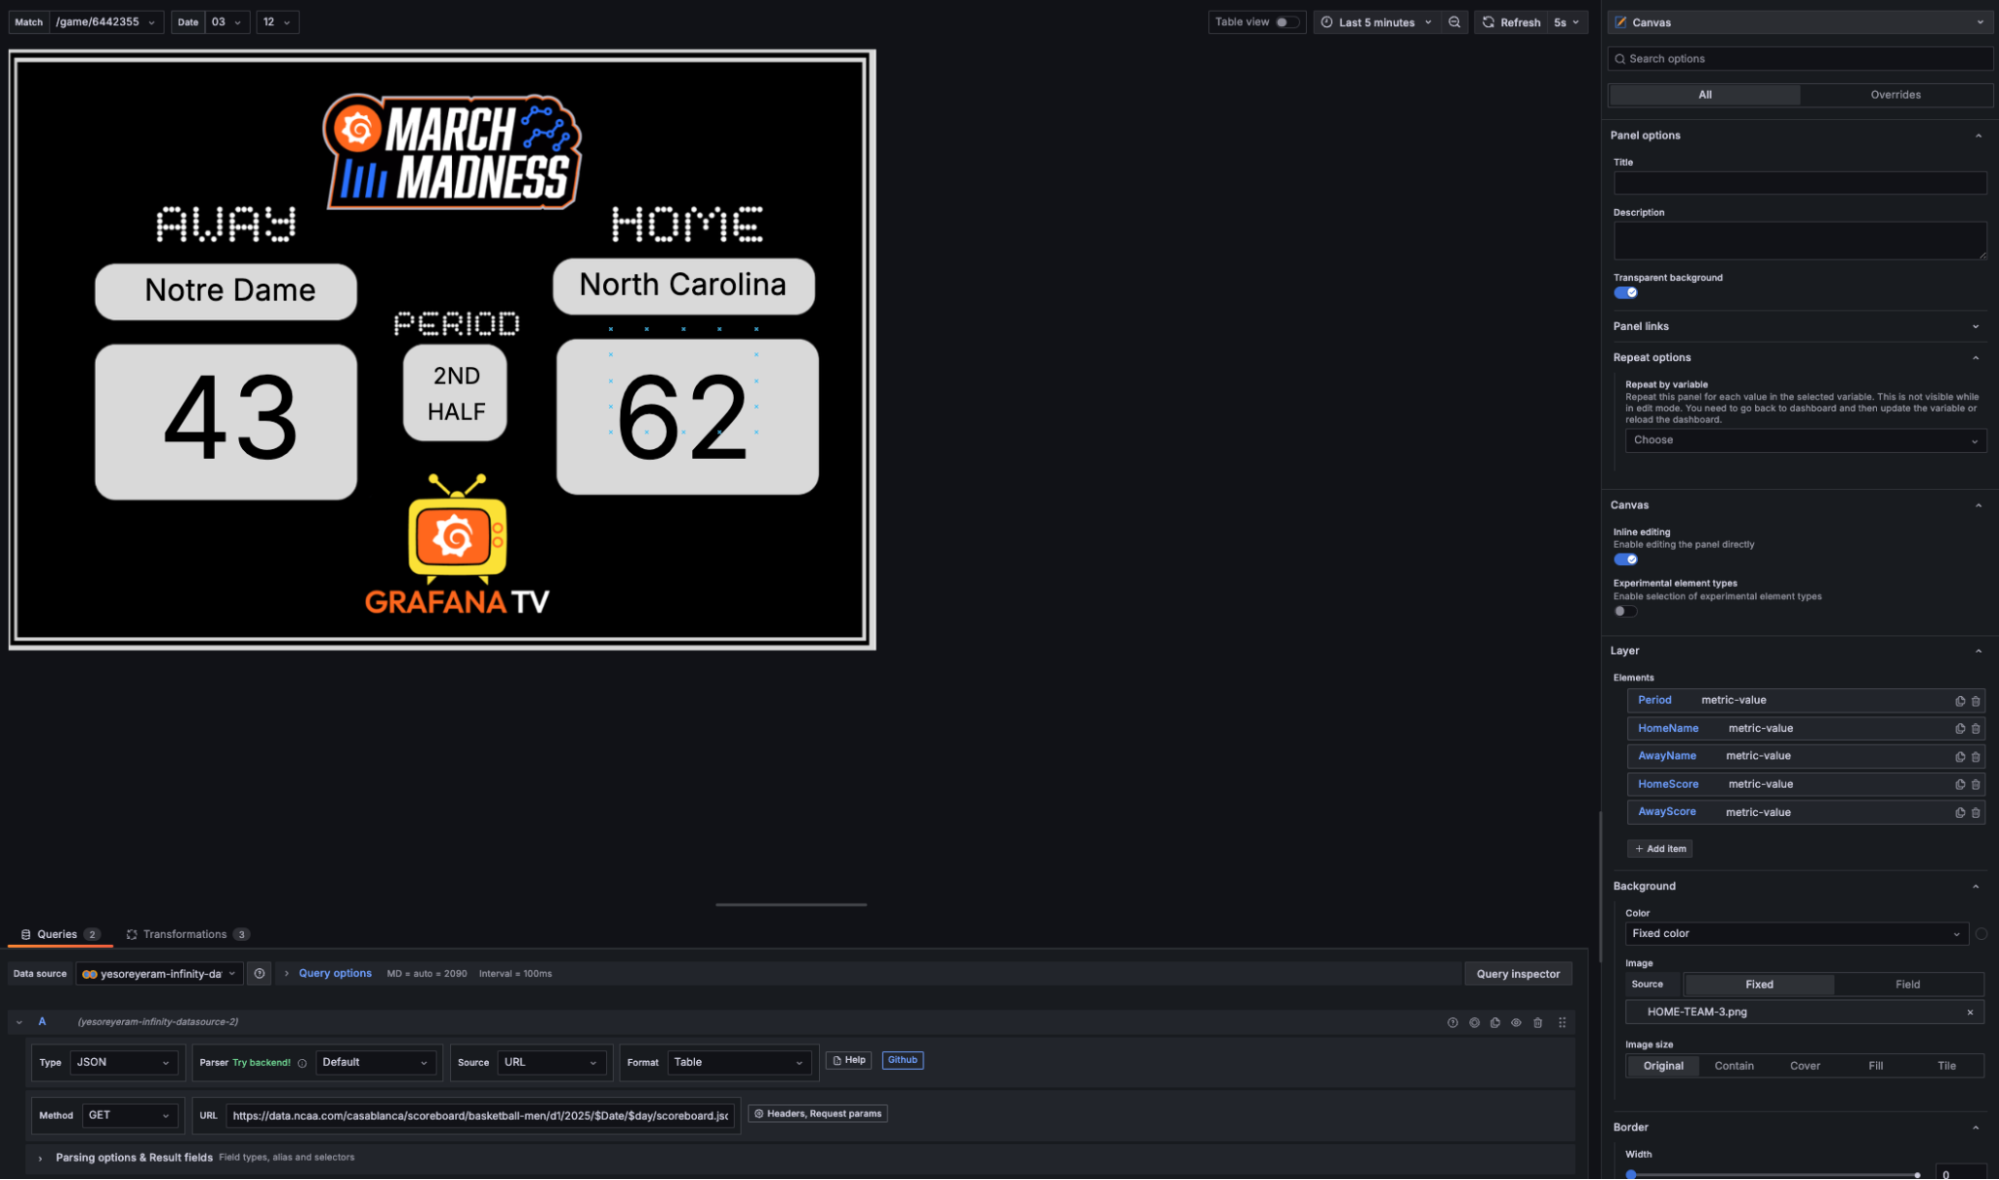
Step 4: Build the ultimate jumbotron scoreboard
Time to bring this to life! Use Grafana’s canvas panel to design a fully customized, dynamic scoreboard.
First, install the canvas panel:
- Go to Configuration > Plugins in Grafana.
- Search for “canvas panel” and install it.
Next, create a custom jumbotron scoreboard:
- Add a new canvas panel to your dashboard.
- Bring in the data using the same method as Step 2 using the Infinity plugin.
- Add another transformation to filter by the game selected
- Filter data by values
- Add condition
- Field:
url - March:
is equal - Value:
$GameID
- Field:
- Add condition
- Filter data by values
- Under panel options, change the background to your image of choice for your jumbotron:
- Image source:
Fixed - Image size:
Original
- Image source:
- Lets now bring in all the elements you want to display:
- Elements: Add item: Metric Value
- Select field:
away.names.short - Continue for all the fields you want to see on your jumbotron
- Select field:
- Elements: Add item: Metric Value
Tip: Get started quickly with this example canvas background image.
BOOM! And that’s it. Your March Madness jumbotron scoreboard is live!
Final March Madness dashboard features
With Grafana’s Infinity plugin and canvas panel, you now have a fully interactive, real-time March Madness dashboard. No more boring score tracking—just select a date, pick a game, and watch the stats roll in!
You can even add dynamic elements such as:
- Color-code scores (e.g., winning team in green, losing team in red).
- Animate score updates using conditional formatting.
- Highlight the top scorer in each game dynamically.
Here’s an example of the dashboard I created with the added visual customizations:
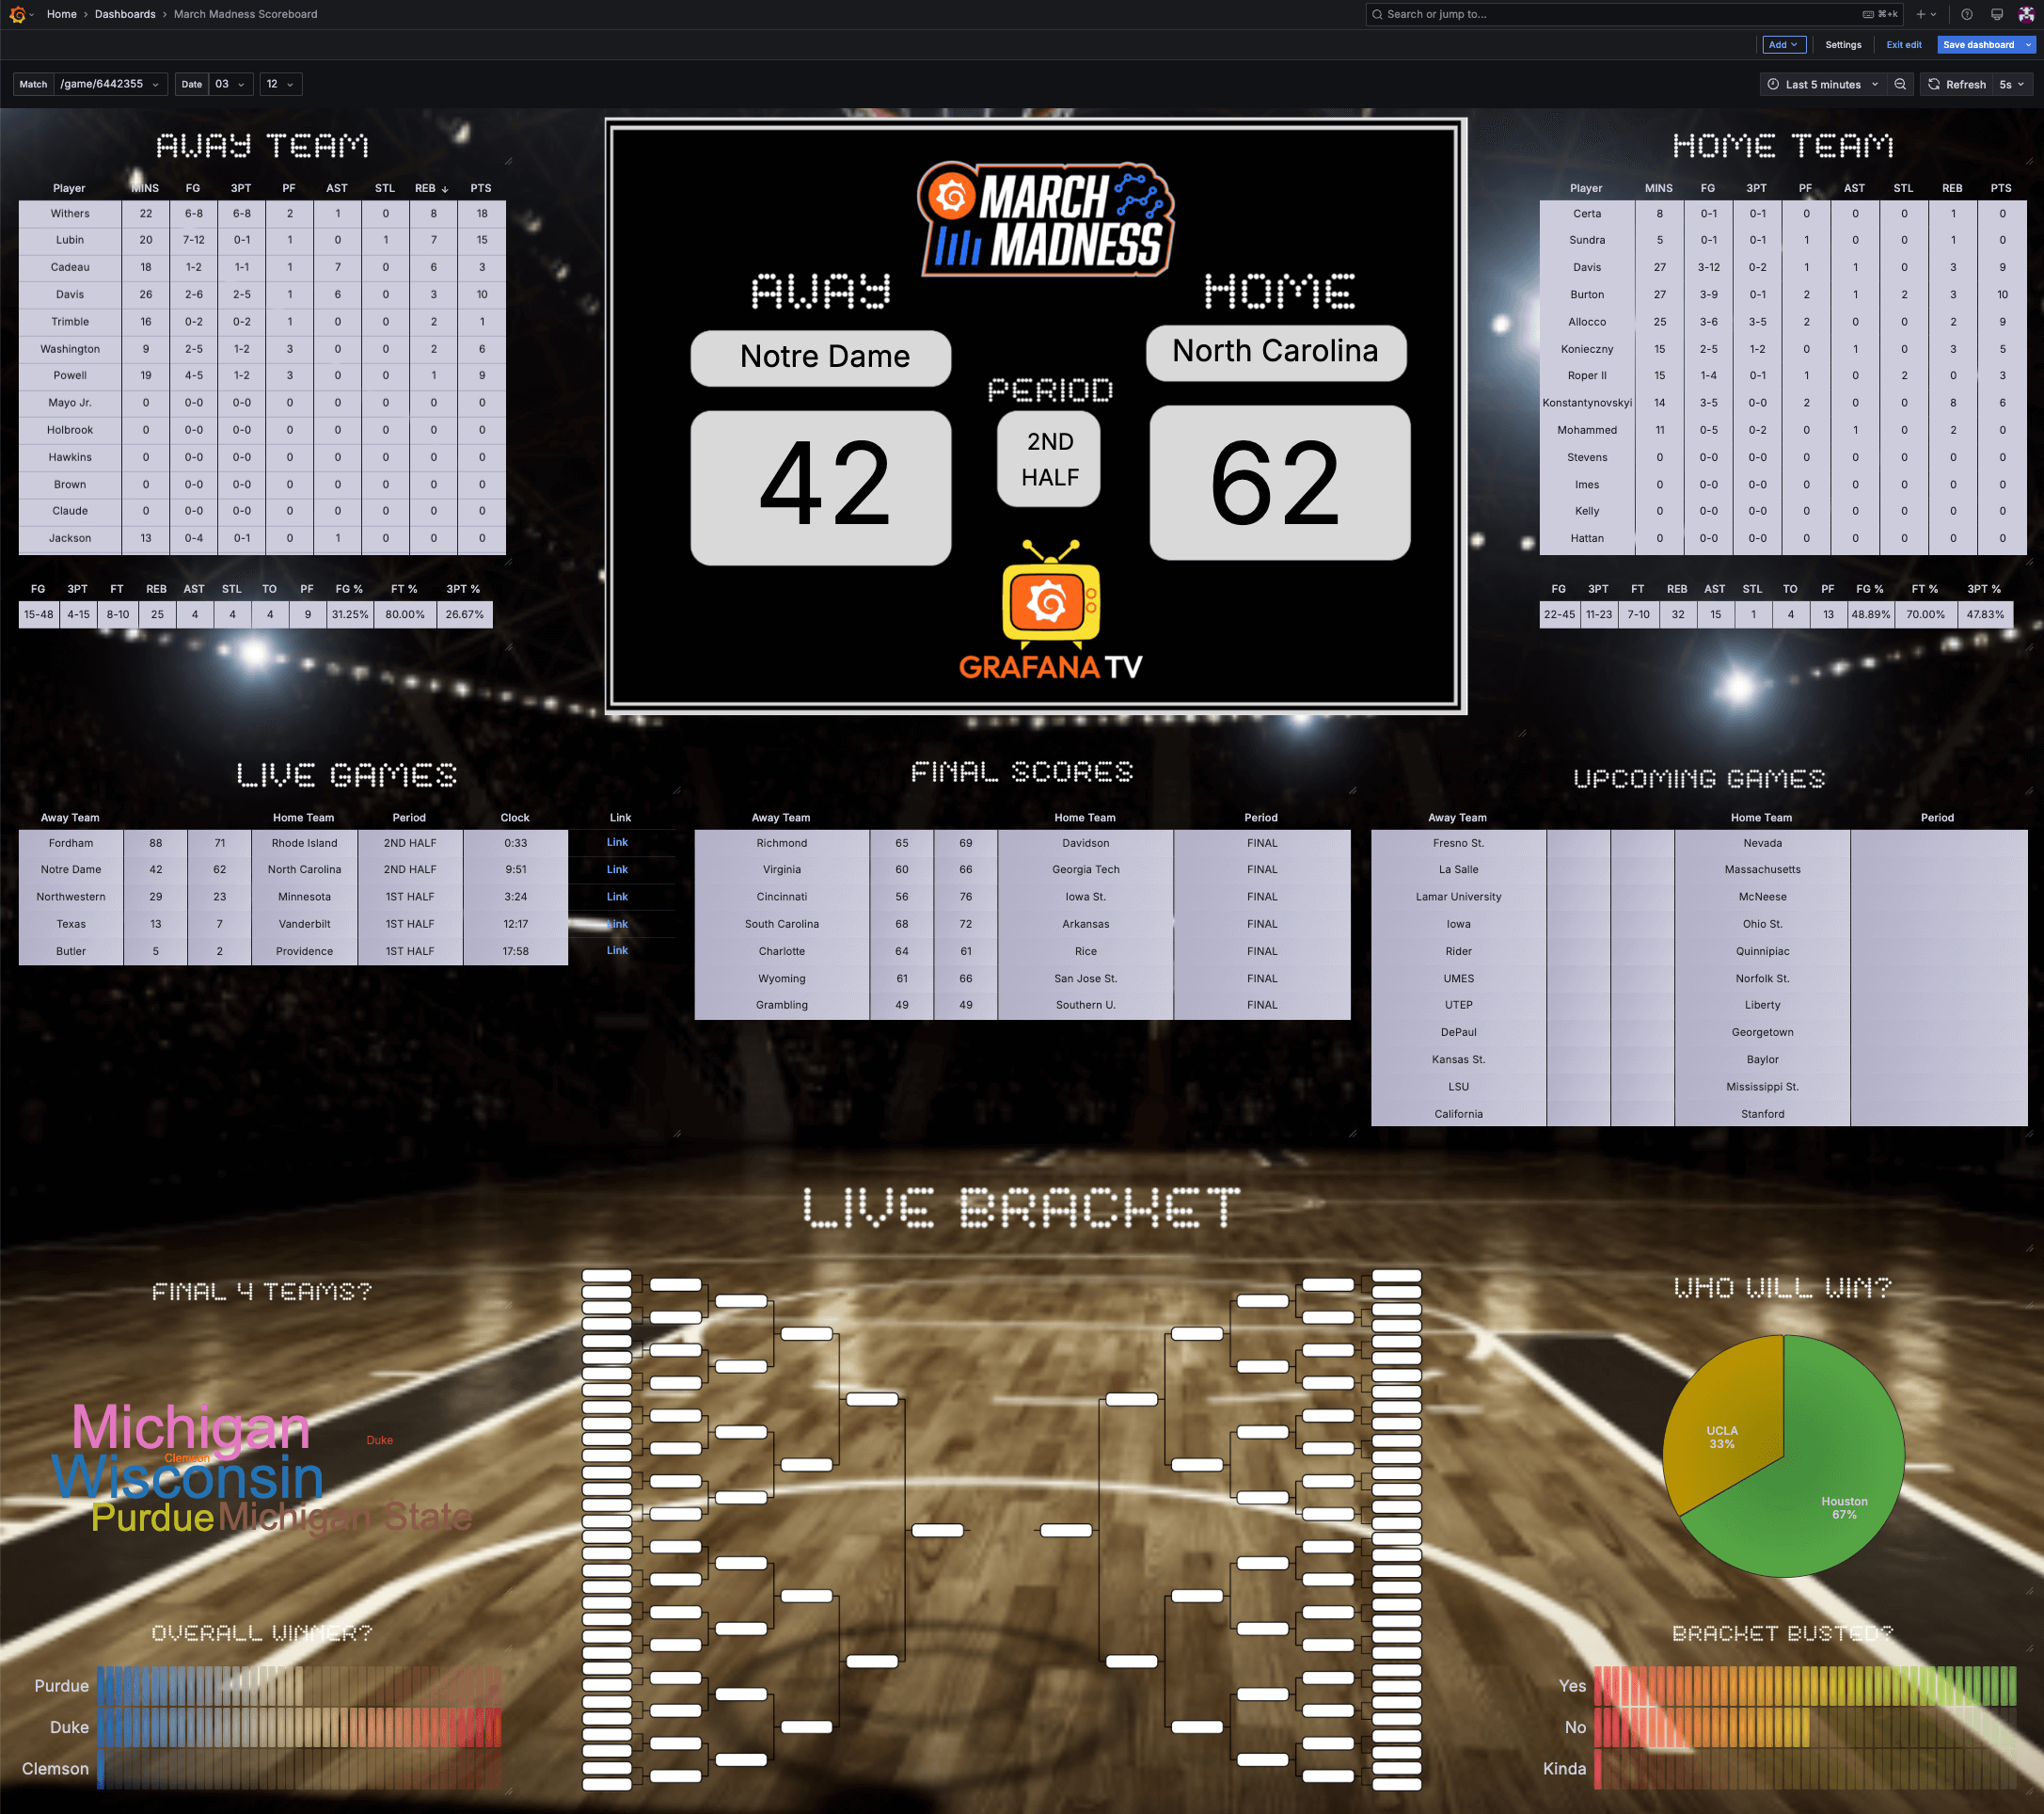
Now go show off your tech-powered March Madness setup to your friends and enjoy the games!
Advance to the next round
Ready to keep dancing? You have so many ways to visualize data in Grafana, so why not take it even further? Here are just a few more ideas to make your dashboard a favorite to win it all:
🏀 Track historical team performance over multiple seasons.
🏀 Enable notifications in Grafana for close games.
🏀 Embed the dashboard on a big screen for the ultimate sports bar experience!
And if you’re looking for a way to enjoy all the excitement with others in the Grafana community, register for our local Sweet 16 watch parties on March 27 for an evening of basketball, networking, and observability. We’re hosting events in Hoboken, Philadelphia, Atlanta, and the Bay Area, and as a special bonus, all guests will be entered into an exclusive raffle for a chance to win two tickets to a local Regional Final game. Don’t miss your shot!
Grafana Cloud is the easiest way to get started with metrics, logs, traces, dashboards, and more. We have a generous forever-free tier and plans for every use case. Sign up for free now!