
The Golden Grot Awards need you: Vote for your favorite dashboard today!
It’s that time of the year again when we throw open our doors and welcome in some of the best Grafana dashboards from the community.
That’s right — the 2025 Golden Grot Awards are in full swing and, after 11 weeks of applications and two weeks of internal judging, we are excited to announce this year’s finalists. Just like in years past, this is where we hope you come in.
Public voting for the Golden Grot Awards is open now through Friday, March 14, so you don’t have much time to weigh in. Continue reading to learn more about the finalists and all their great work in both the Personal and Professional categories. Then, we hope you’ll cast a vote for your favorite dashboards!
The grand prize winners in each category will be celebrated on stage at GrafanaCON 2025, our biggest community event of the year, taking place May 6-8 in Seattle.
Finalists in the Personal category
Ruben Fernandez: displays real-time data for the International Space Station (ISS)
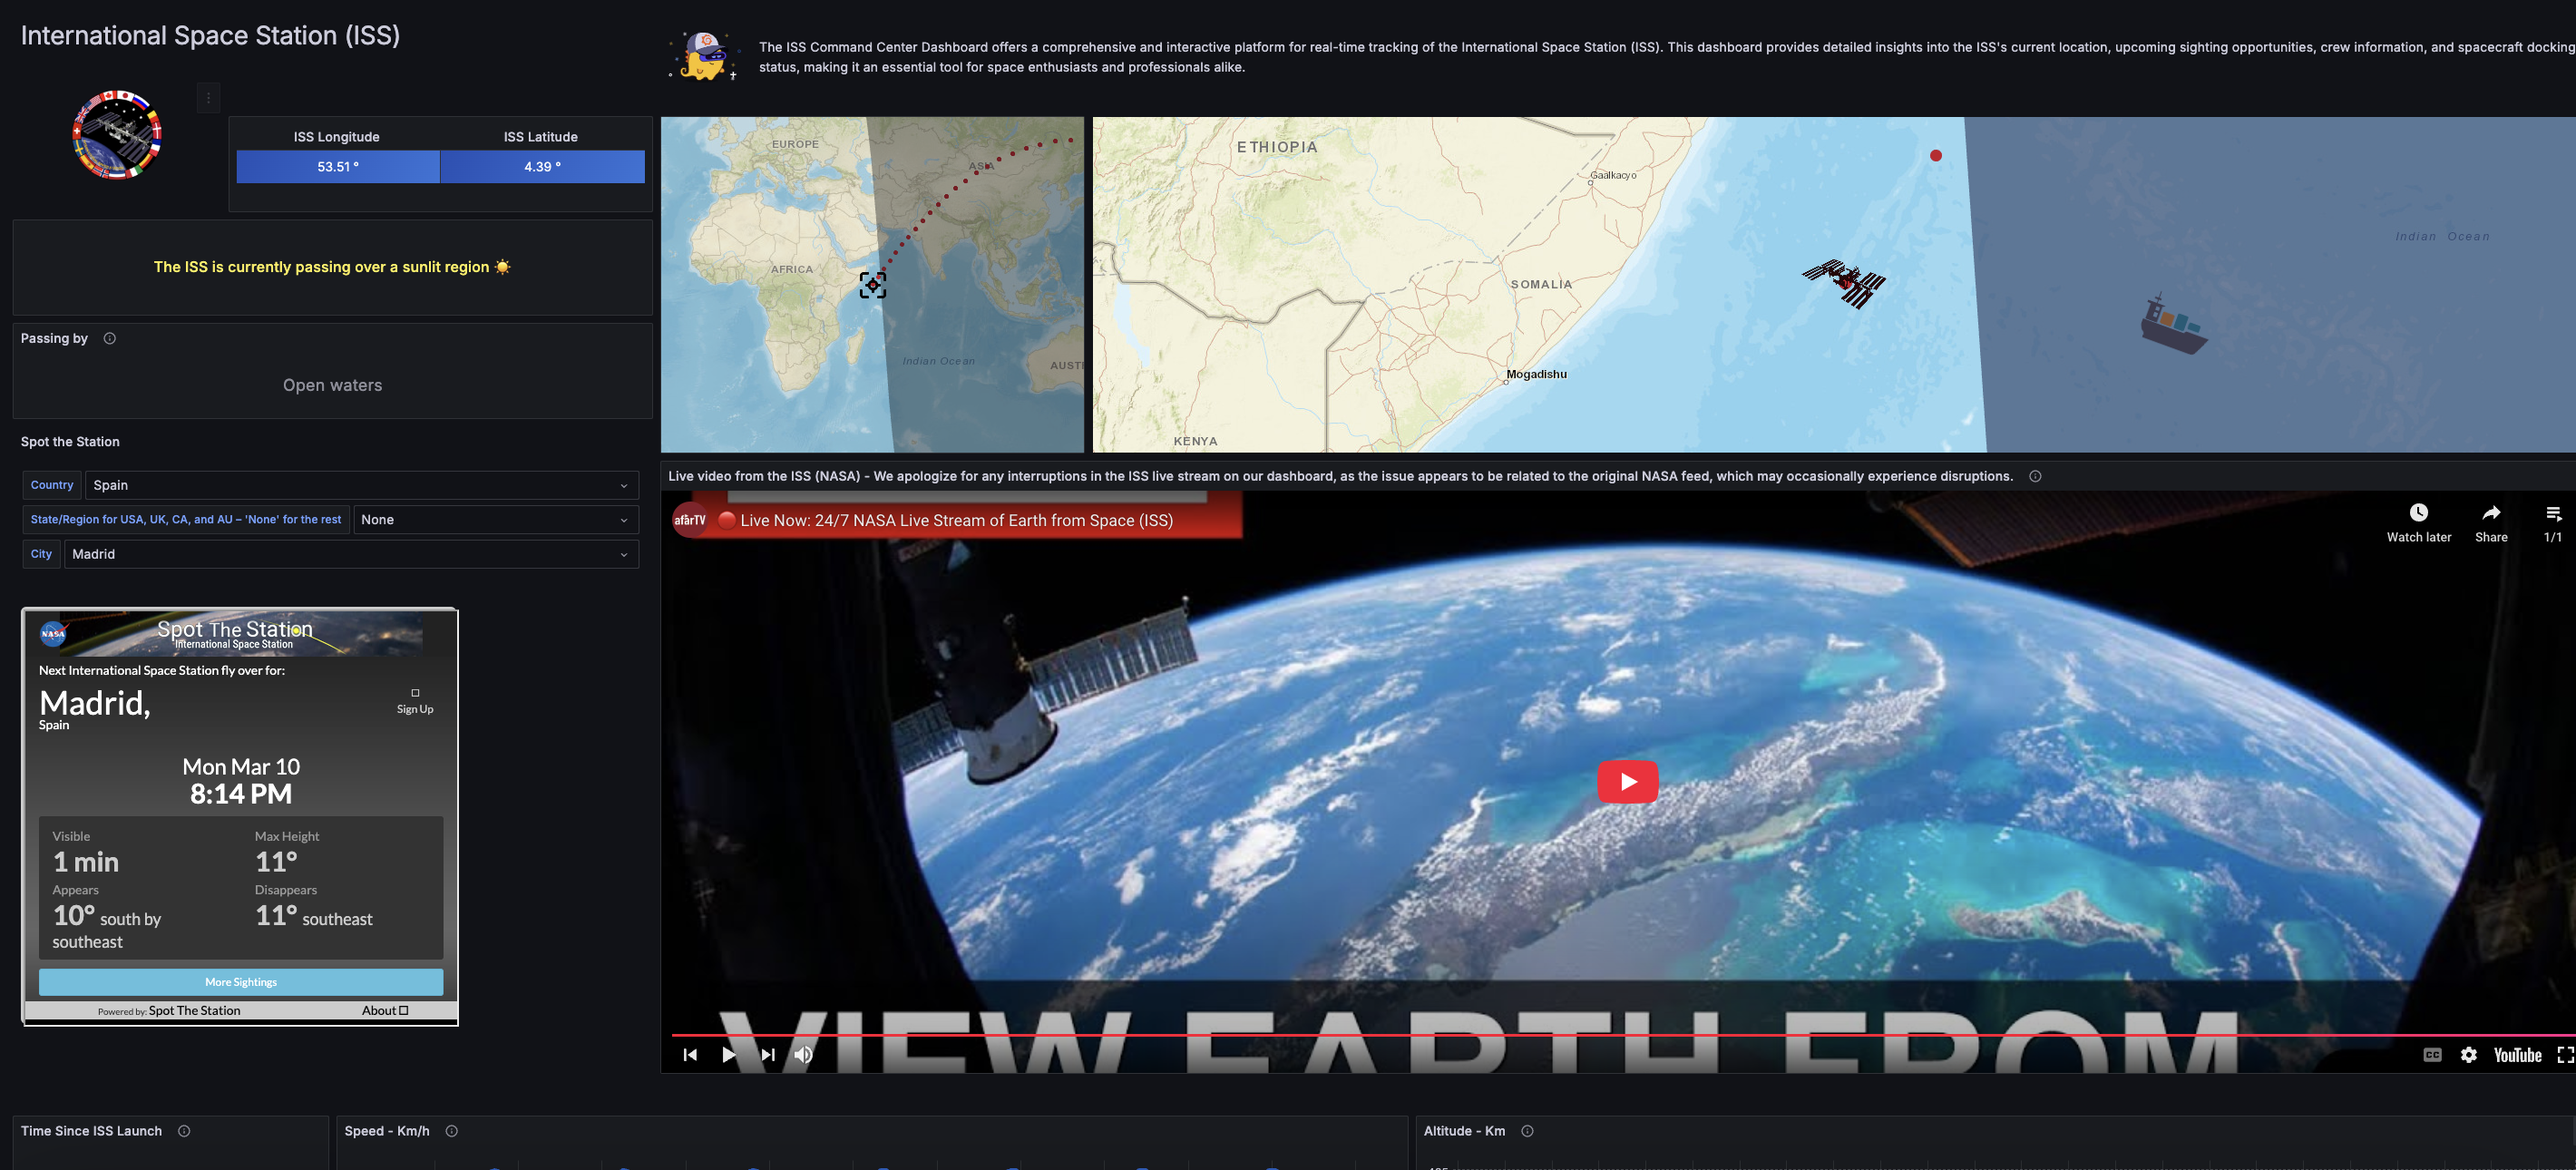
Ruben Fernandez built an interactive Grafana dashboard dedicated to the International Space Station (ISS), featuring a real-time map of its location, live NASA video streams, and detailed information about the station’s crew, altitude, speed, and docked spacecraft. He utilized multiple API calls, Python, and Prometheus to gather and display ISS data, while also enabling users to check when the station will be visible in their location.
“You can really feel the enthusiasm for space exploration that went into this dashboard, just by looking at it,” one of our judges said. “I love how interactive it is — it’s the kind of thing I’d want to share with friends just to say, ’look at this cool thing I found!'”
Ruben’s full dashboard is accessible here (username is goldengrotshow and the password is Goldengrot2025).
Martin Ammerlaan: captures metrics for an electric motorcycle
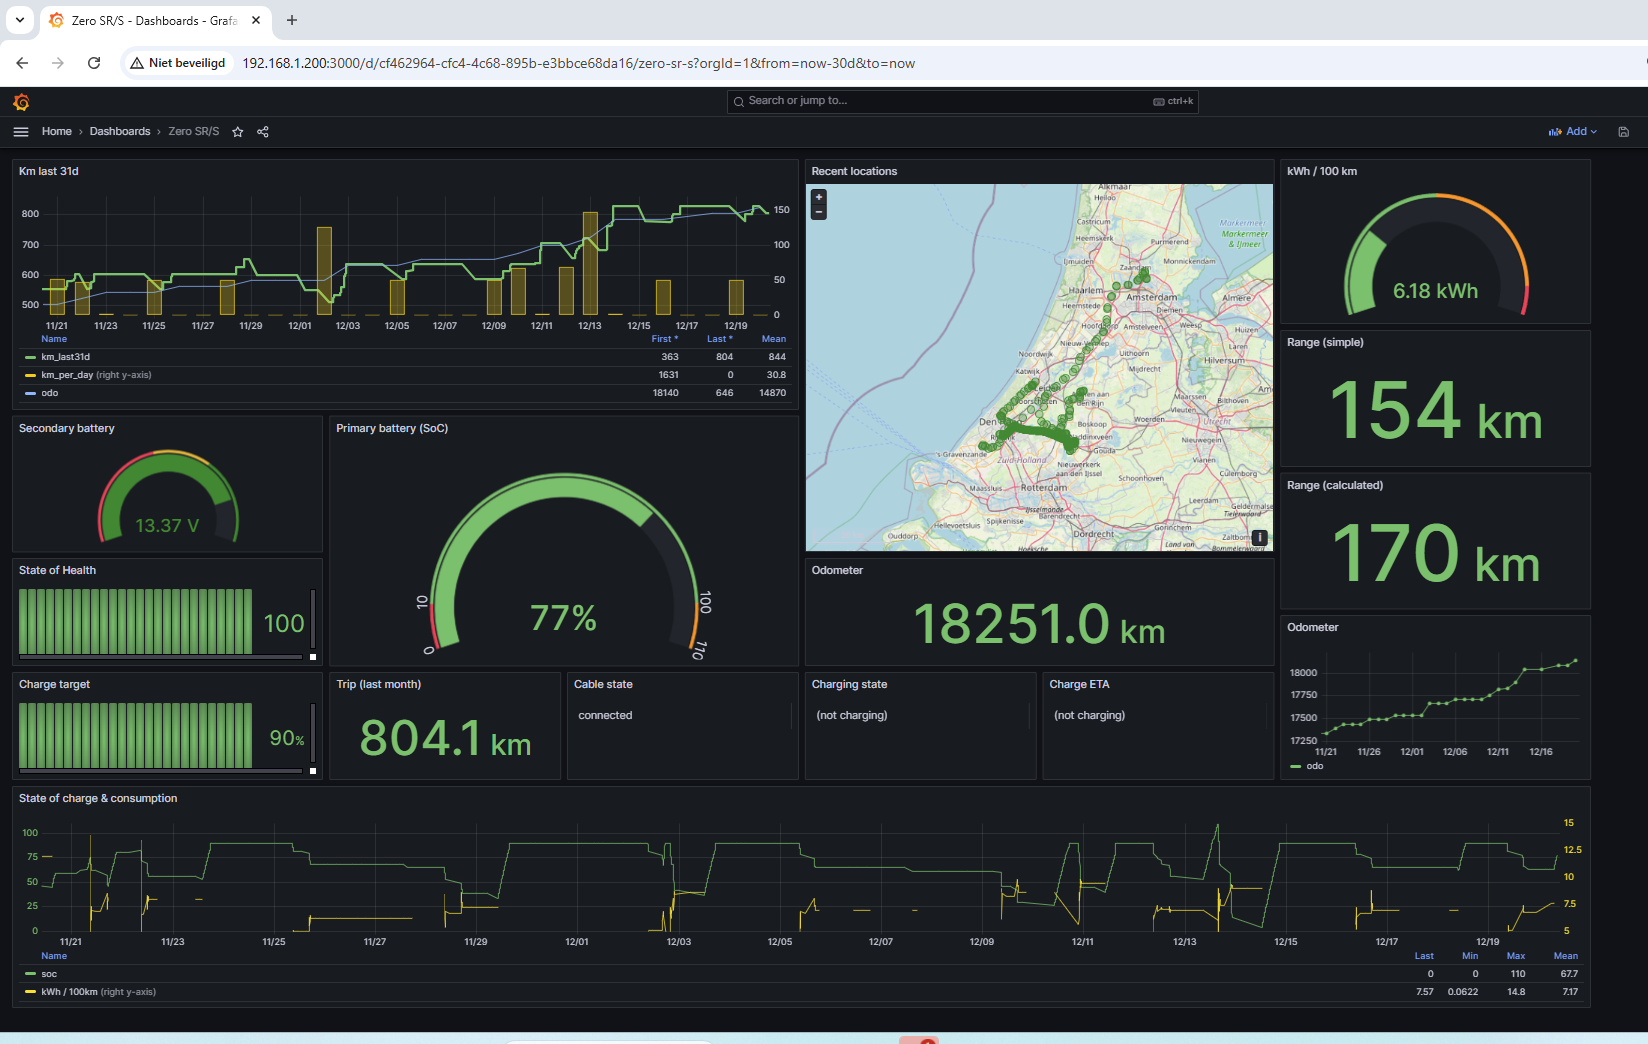
Martin Ammerlaan built a comprehensive Grafana-based monitoring system for his fully electric Zero Motorcycles SR/S. His system captures detailed consumption metrics, including data on distance traveled and state-of-charge changes, to provide valuable insights into the bike’s efficiency and performance.
Judges, in particular, applauded Martin’s use of the motorcycle’s API endpoint as a data source.
“What really impresses me about this dashboard is how Martin tapped into the bike’s API, which is packed with way more data than you get in the app,” said a judge. “By digging into all that extra information and figuring out a smart way to organize it, Martin created a dashboard that translates motorcycle metrics into super useful insights.”
Roland: gauges the impact of space weather conditions
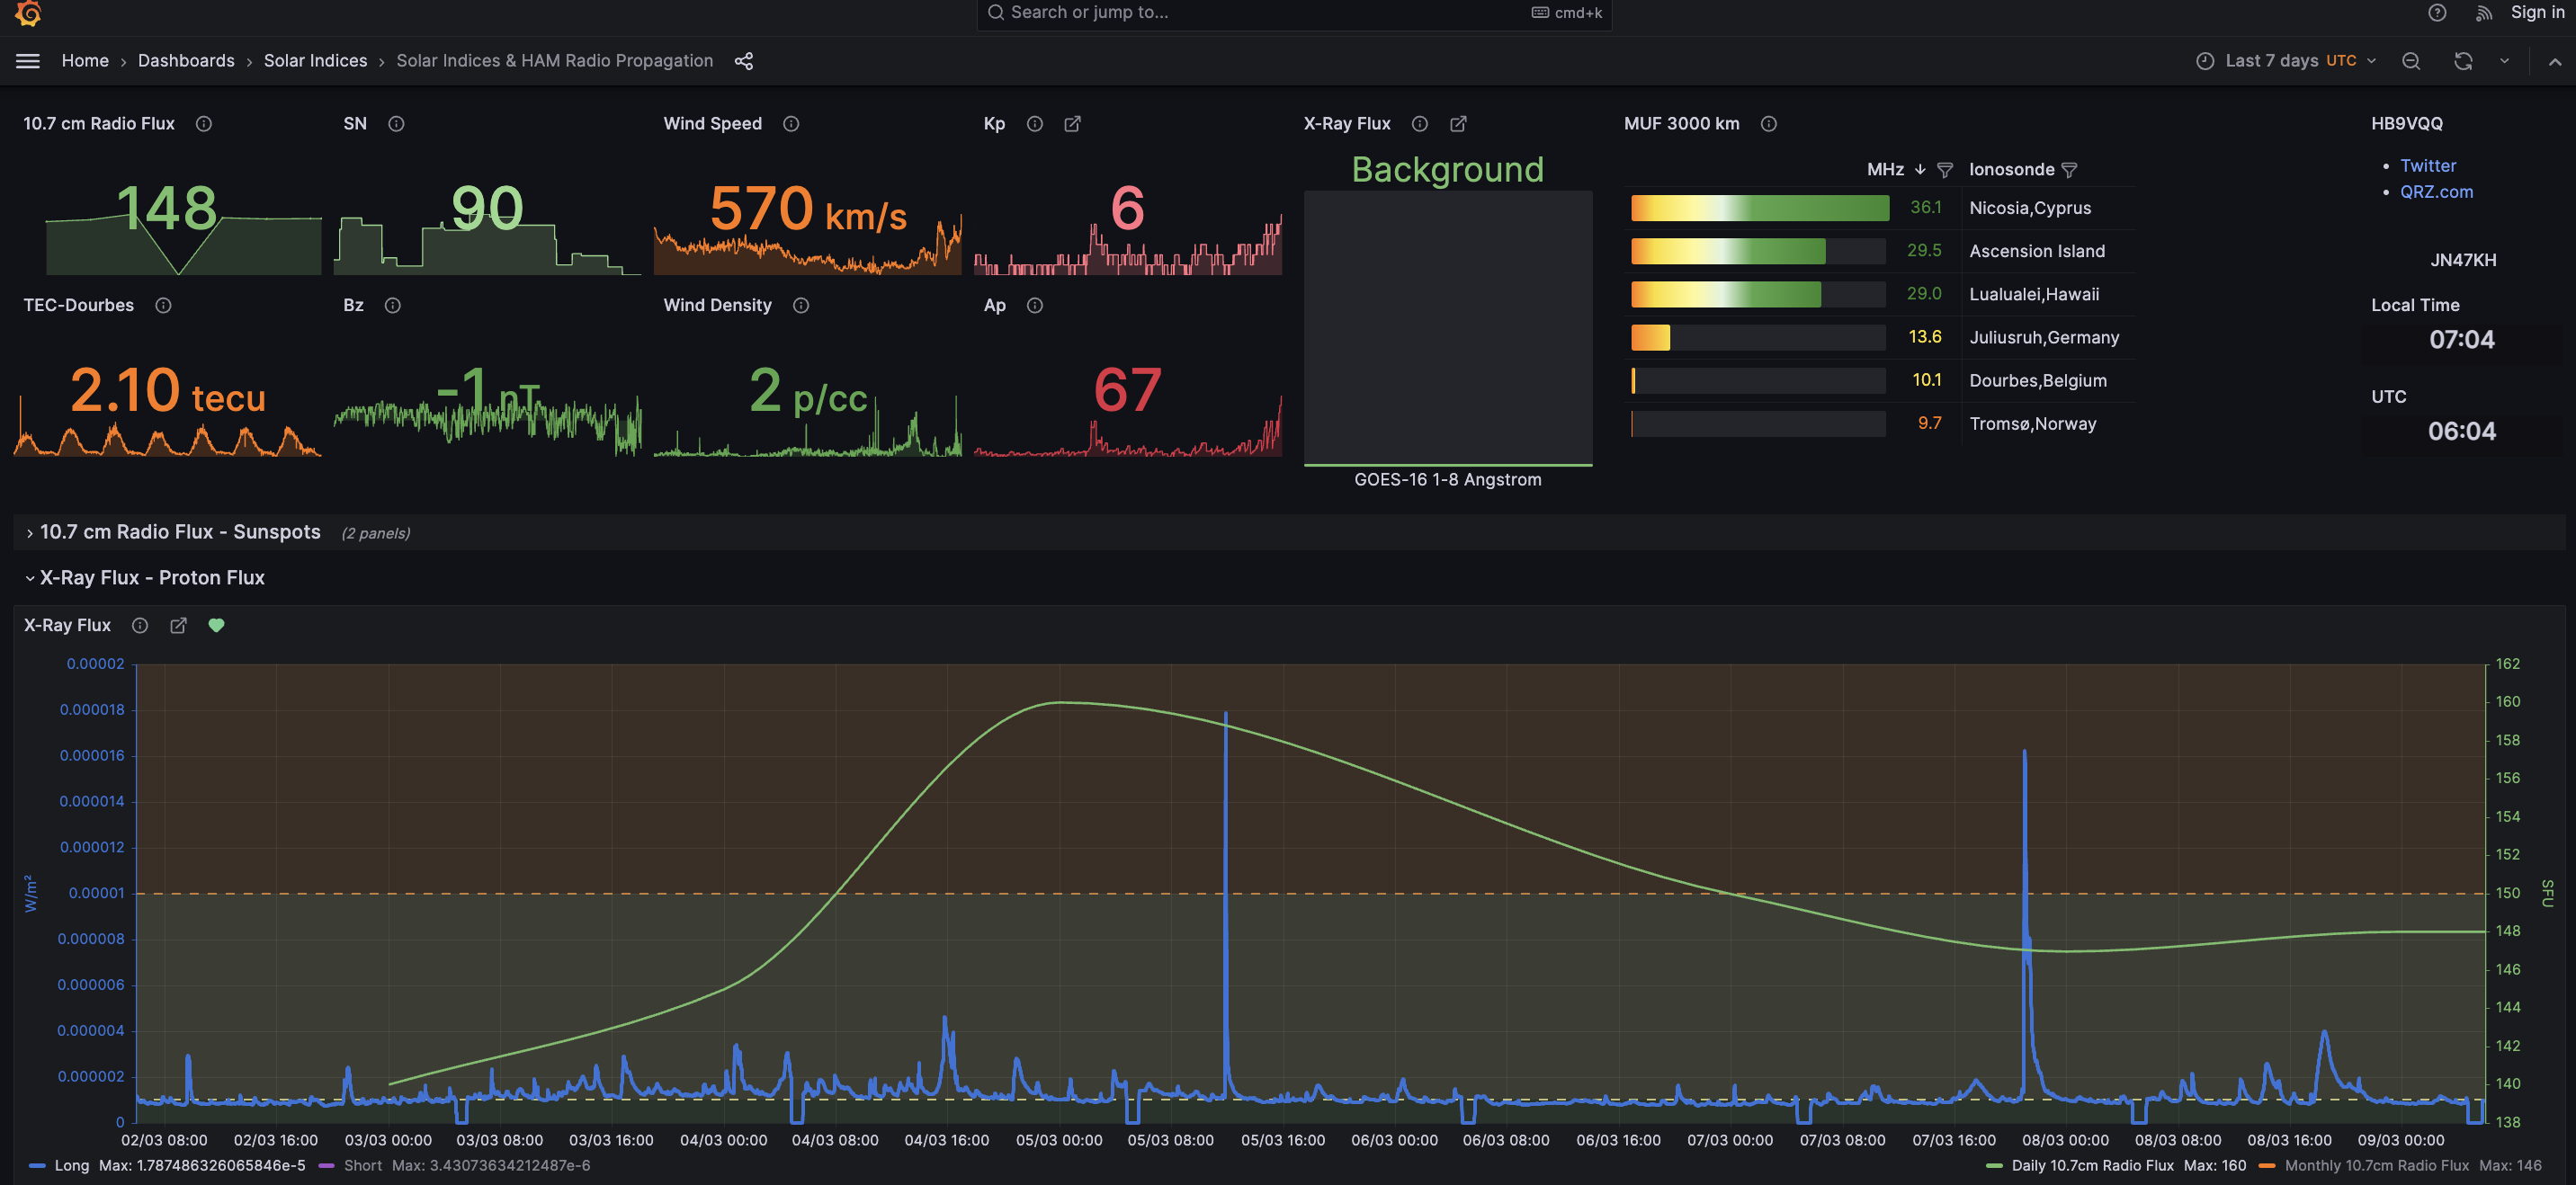
Roland has developed a Grafana dashboard focused on Space Weather and Amateur Radio High-Frequency Propagation KPIs. For the last 3+ years, this dashboard has allowed Roland to analyze the impact of space weather conditions and solar cycles on global shortwave radio communications, improving predictions and operational efficiency for amateur radio enthusiasts and professionals alike.
“Each panel is packed with helpful tooltips, making it easy to navigate complex data and understand it,” one judge noted. “I enjoy dashboards that go beyond just displaying numbers — they should be engaging and provide insights I wouldn’t have found elsewhere. This one does exactly that, making it both informative and exciting to explore.”
Roland’s full dashboard is accessible here.
Nik Hawks: monitors annual rainfall and provides weather insights
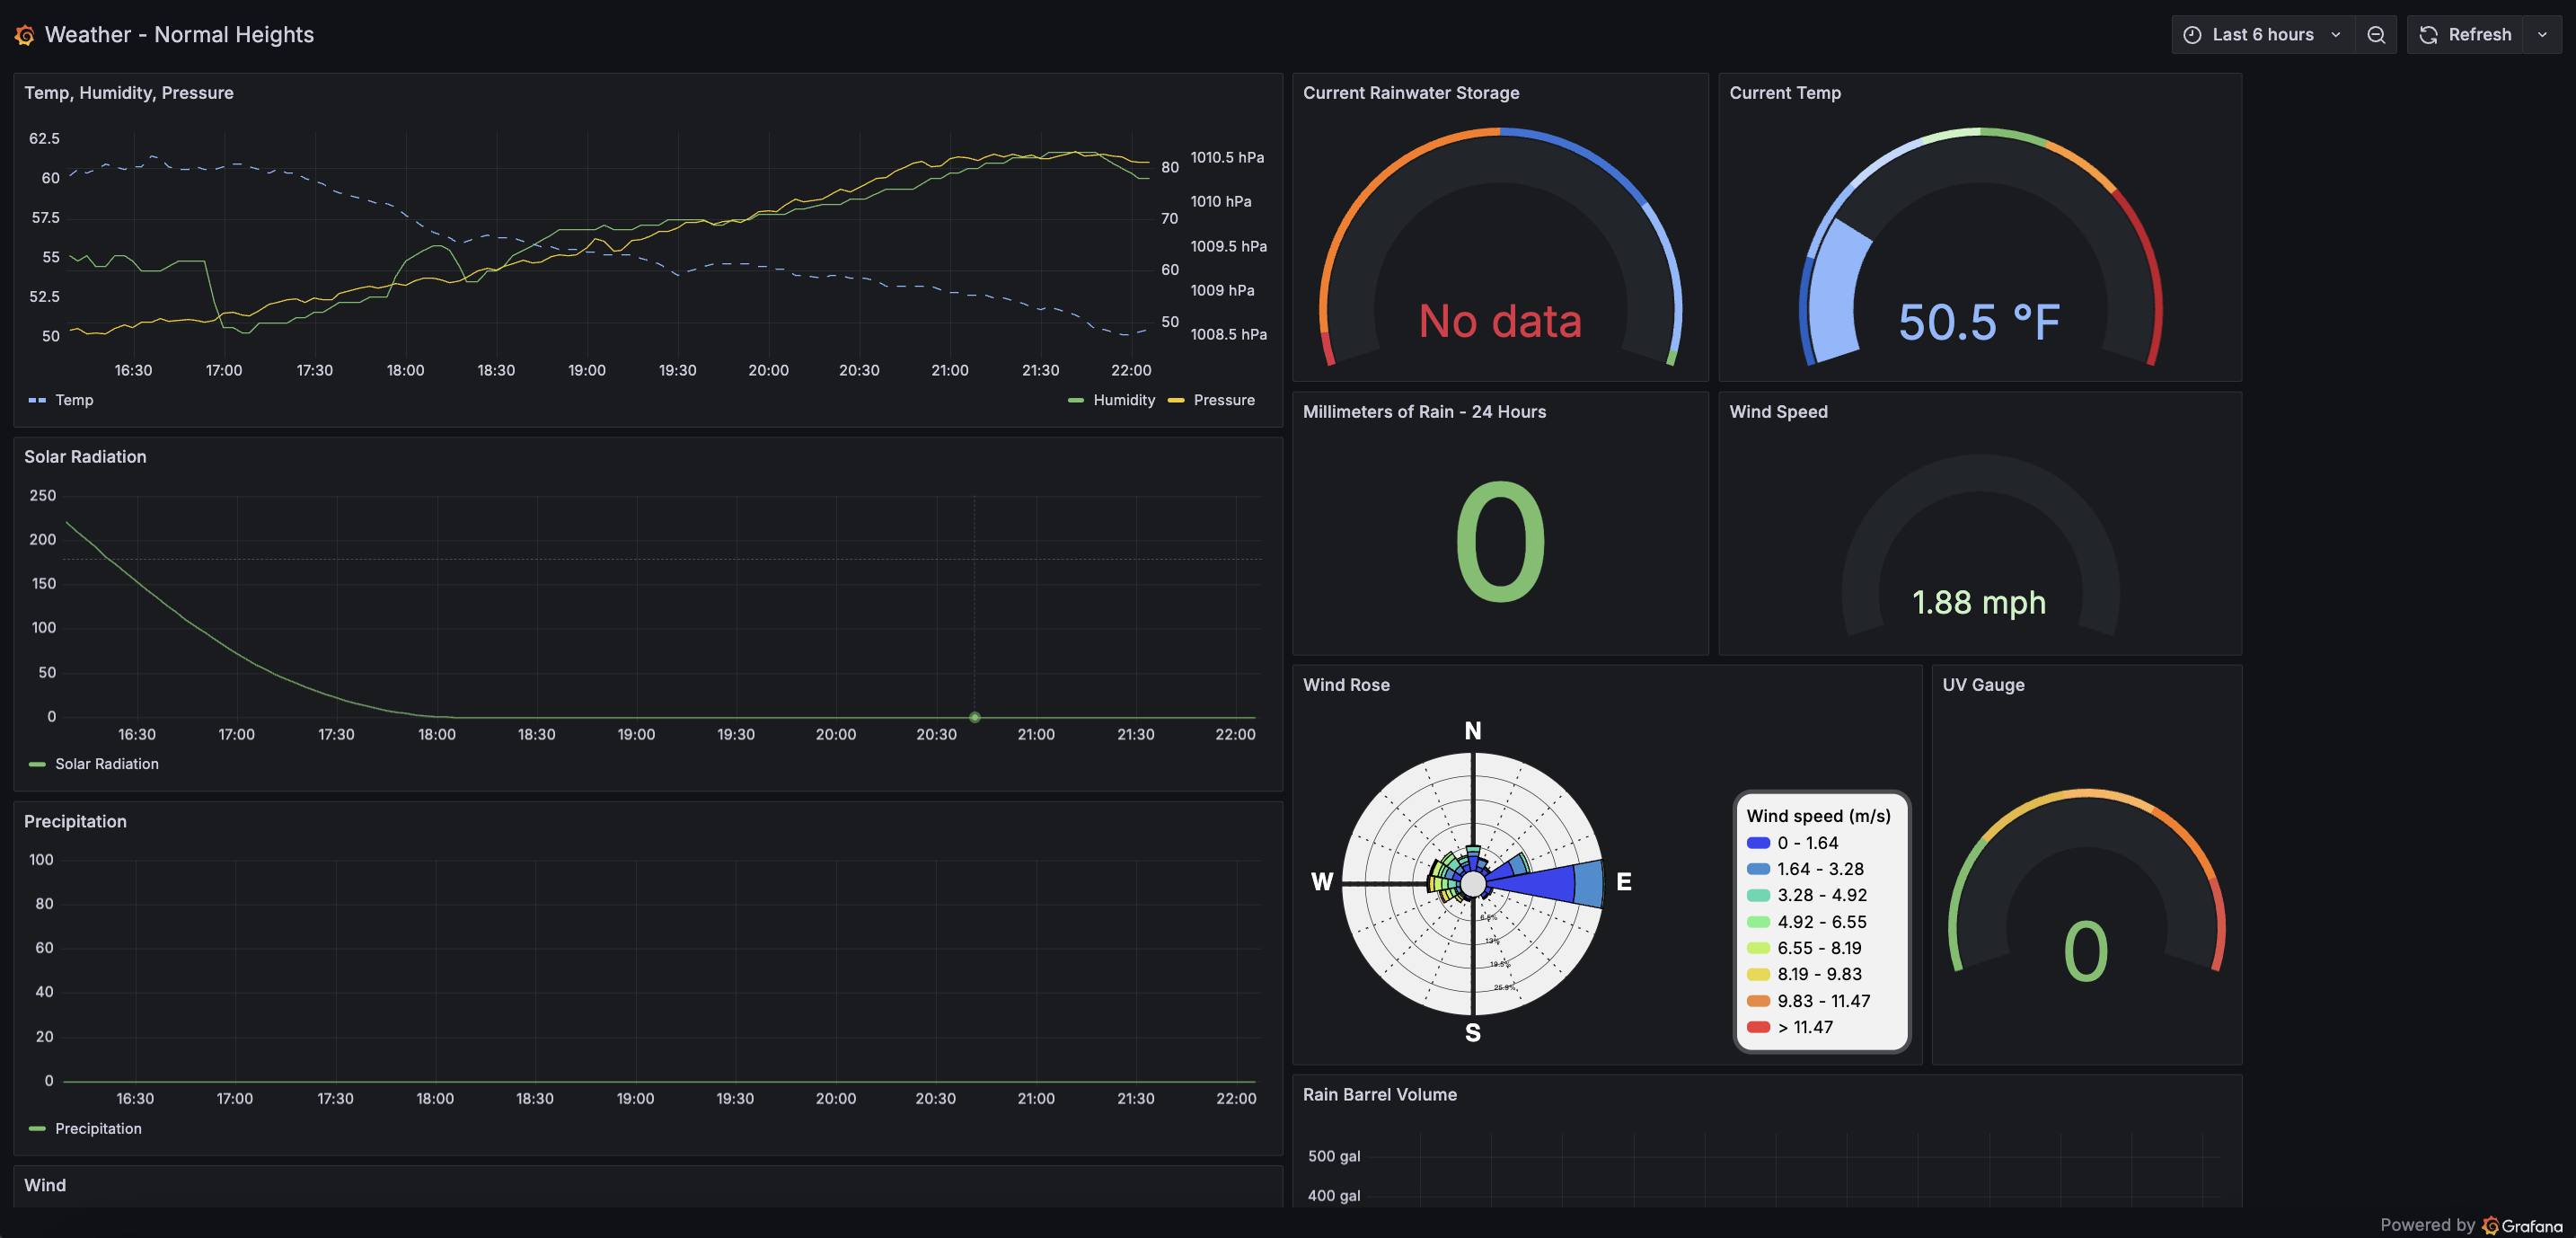
Nik Hawks built a Grafana dashboard to monitor annual rainwater collection in San Diego using LoRaWAN sensors — a combination weather station and liquid distance measurement sensor. Using his Raspberry Pi-hosted dashboard, he tracks real-time rainfall collected in his 550-gallon catchment system, provides broader weather insights, and monitors the real-time network health of the LoRaWAN sensors themselves.
Beyond his own personal use for the dashboard, Nik’s work has caught the attention of others who live nearby, and has inspired at least one neighbor to look into rainwater storage on their own property.
“What really stood out to me about this dashboard was the community focus behind it,” said a judge. “I love the idea of a group of neighbors using Grafana to monitor their environment together. It’s a great example of data bringing people together.”
Nik’s full dashboard is accessible here.
Brian Davis: tracks home energy consumption
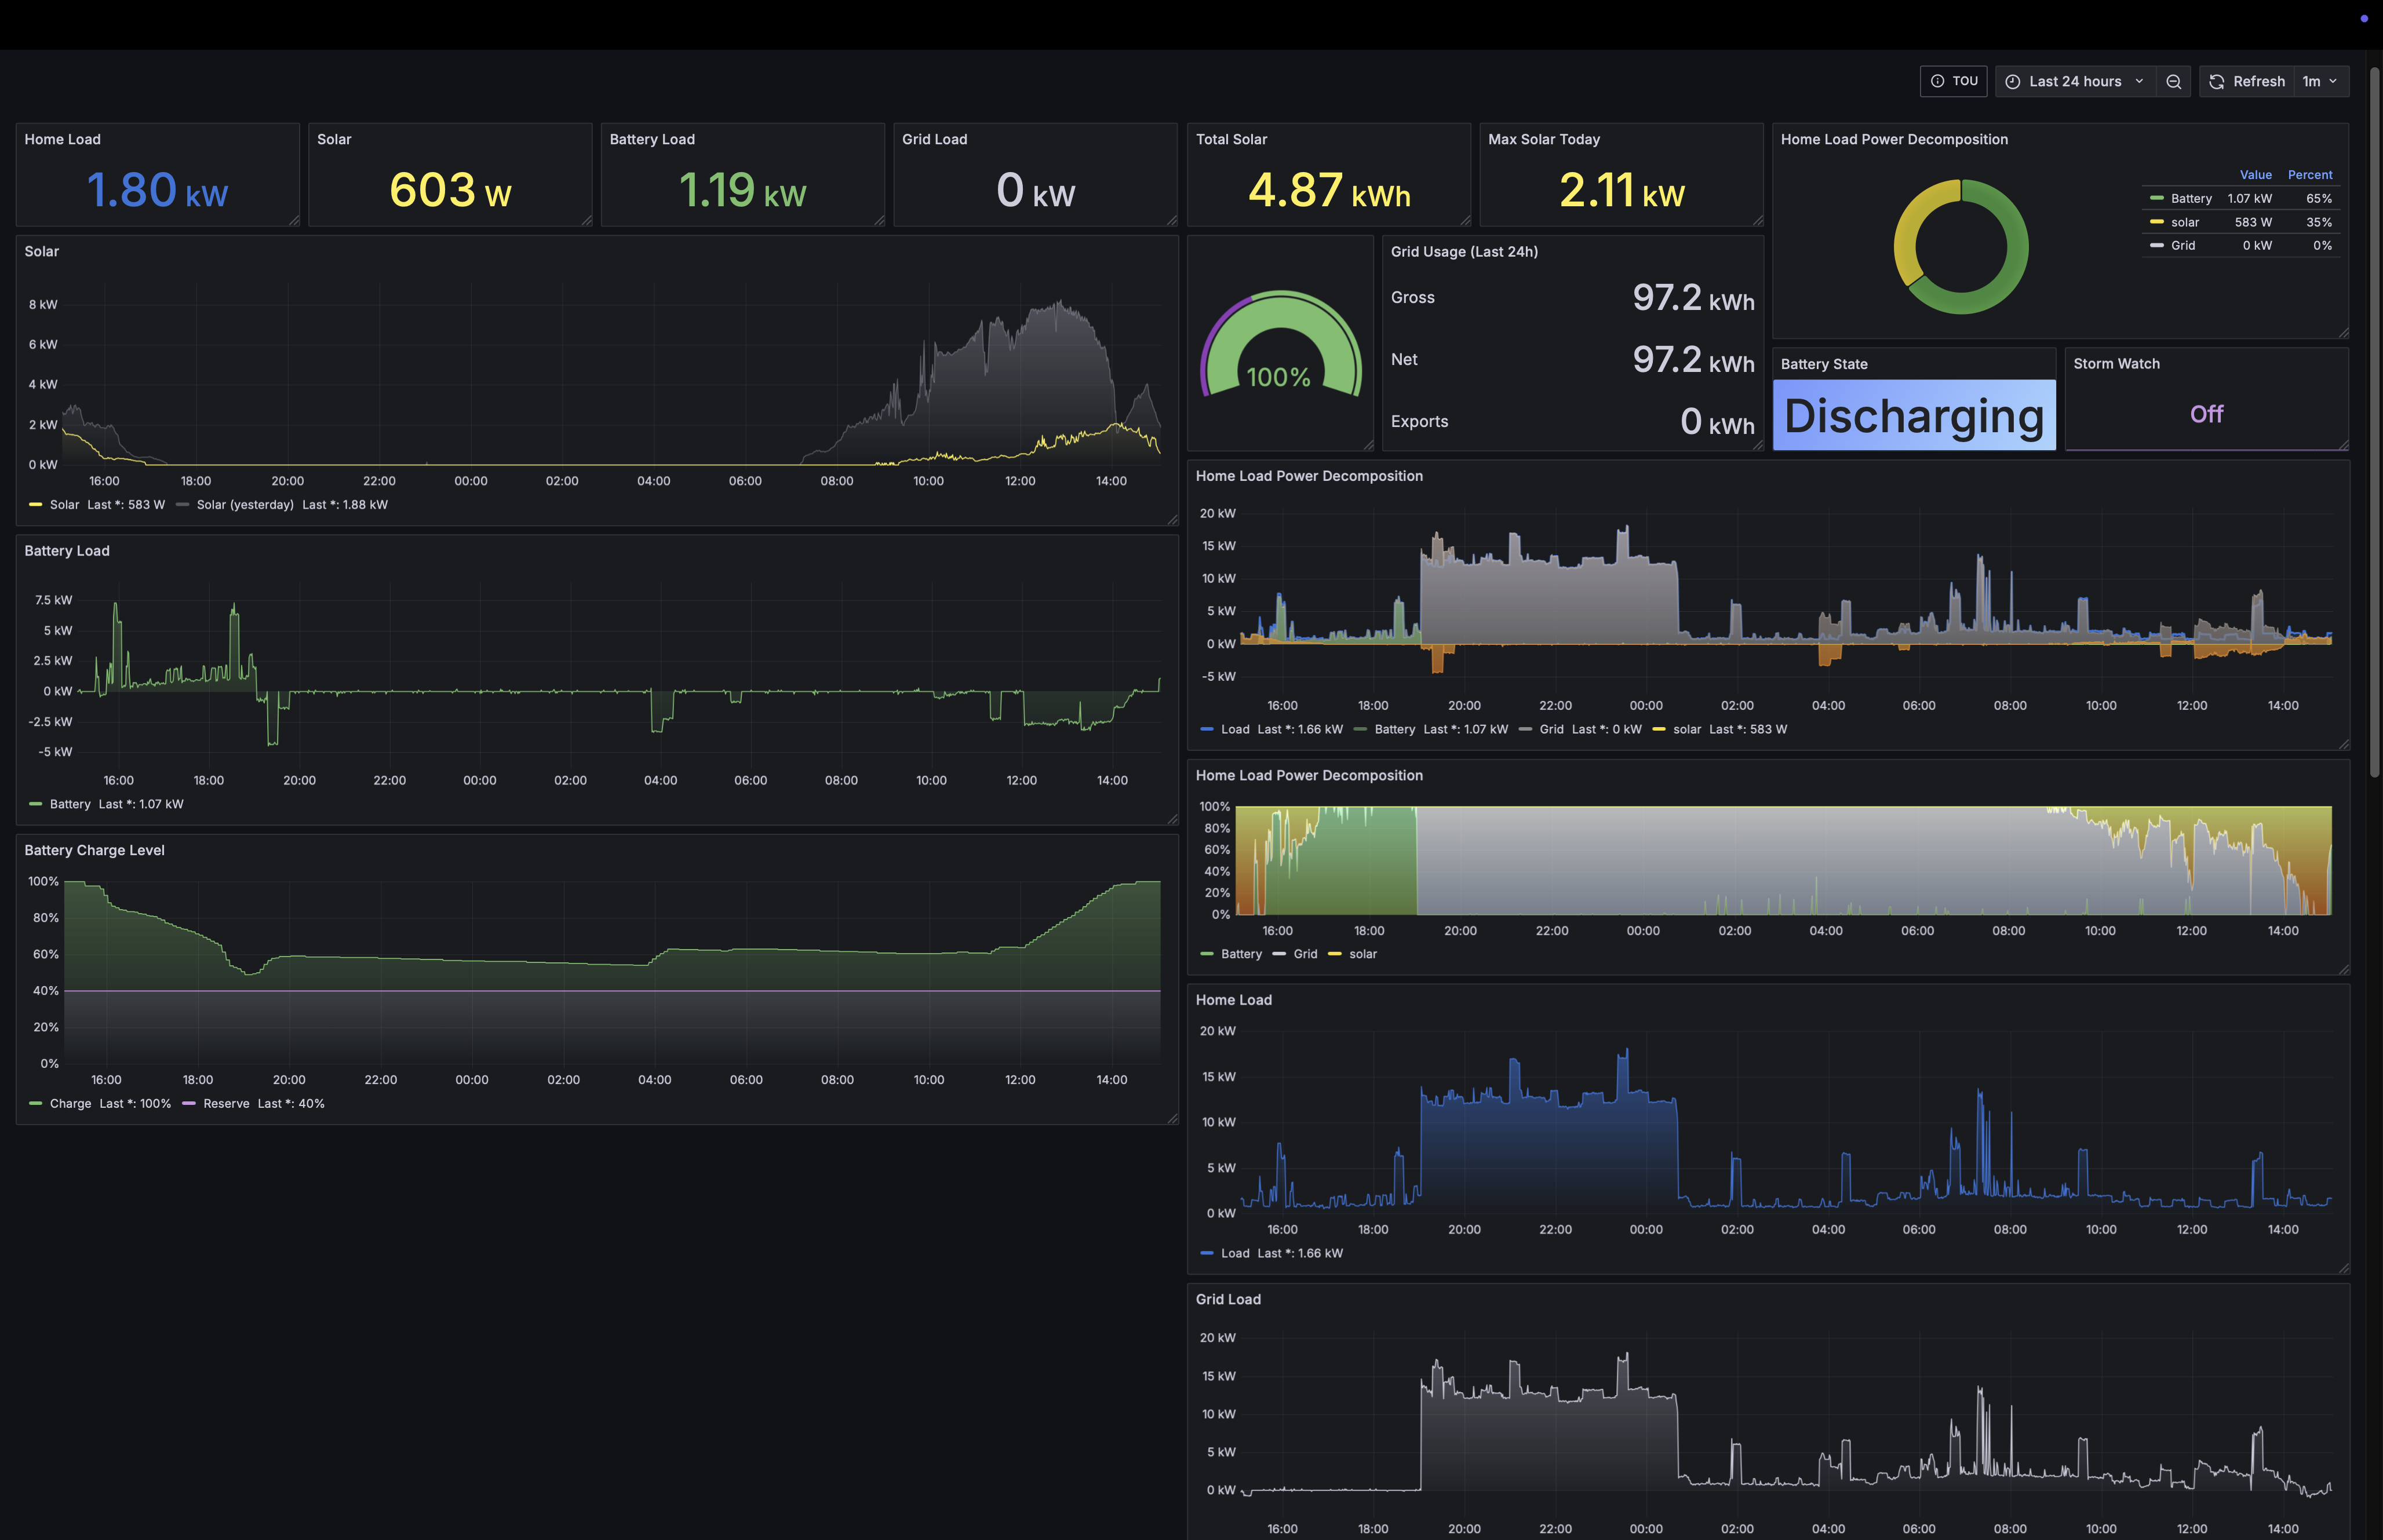
Brian Davis created a dashboard to monitor his home’s energy consumption, solar production, and Tesla Powerwall battery usage. He uses Home Assistant to pull data from the Powerwall and export it to Prometheus before visualizing it in Grafana, which provides real-time insights into energy usage patterns, appliance consumption, and opportunities for efficiency improvements.
“This dashboard is jam-packed with information on electricity consumption,” one judge said. “I love that Brian has been able to use this information to not only reduce energy consumption and costs, but to develop a deeper understanding of energy usage in general.”
Finalists in the Professional category
Grant Chase: monitors real-time and historical waste water treatment process data
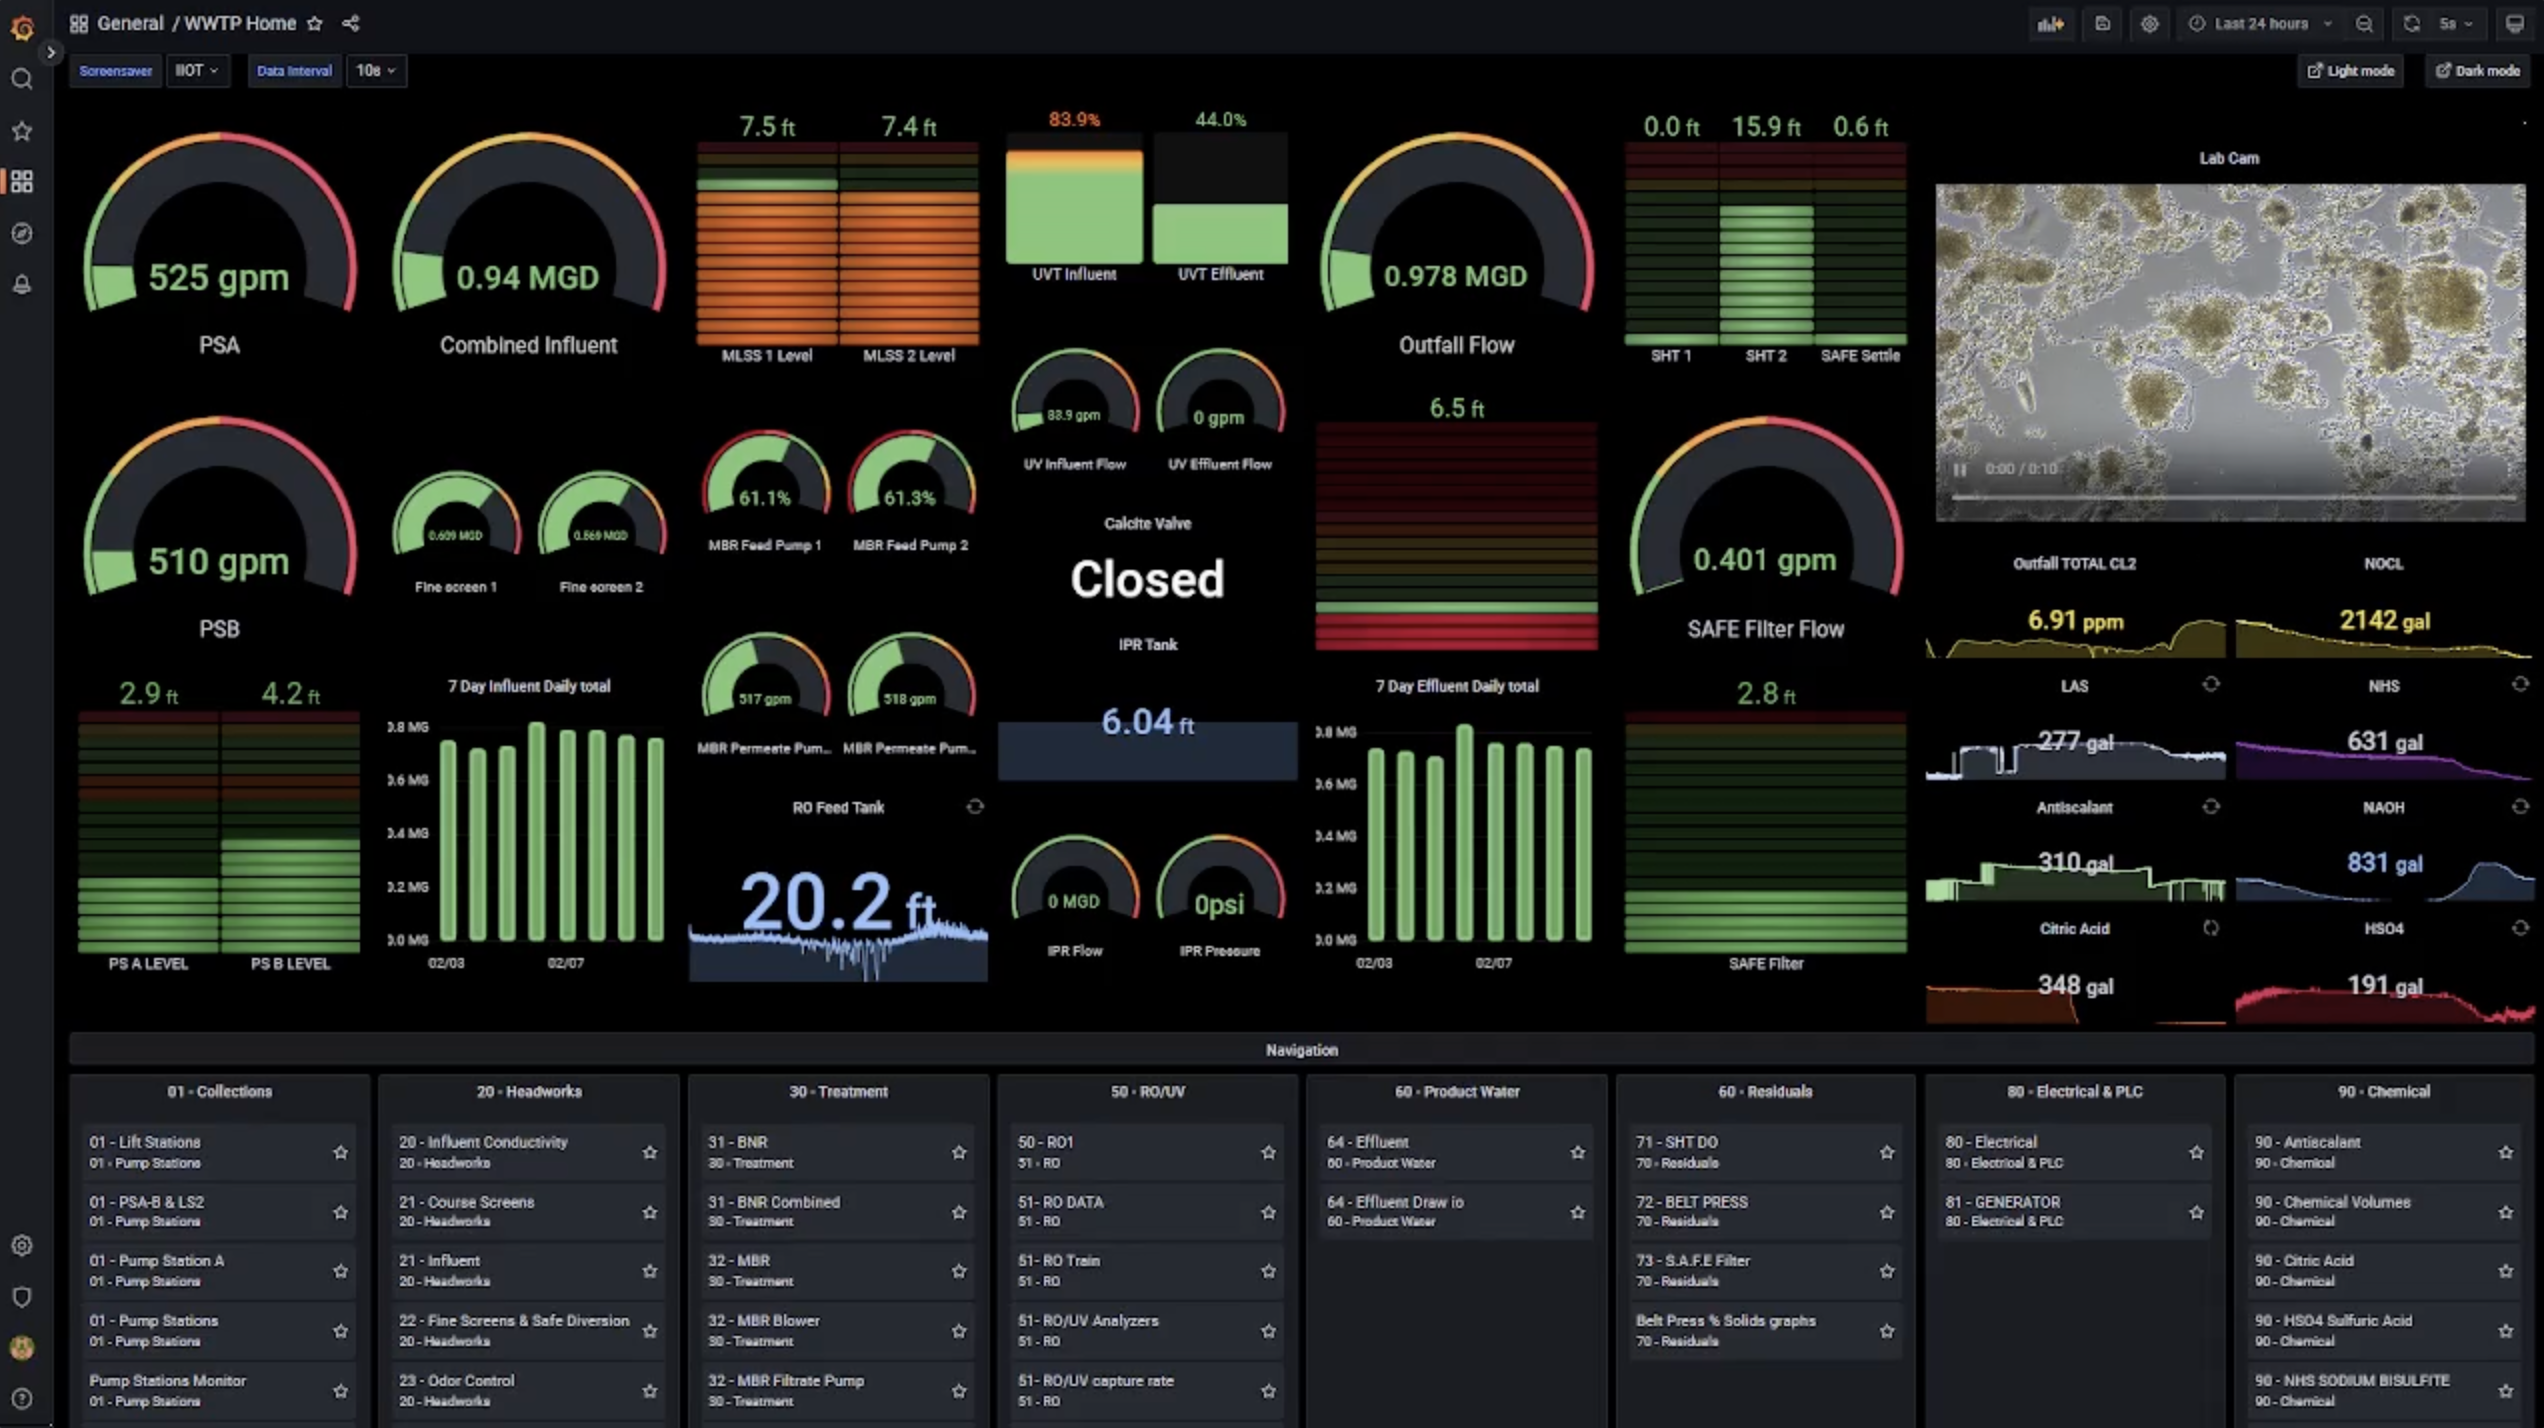
Grant Chase developed a Grafana dashboard that he and his team at the Morro Bay Waste Treatment Plant use to monitor real-time and historical process data. It integrates data from hundreds of sensors, motors, and analyzers collected by the SCADA system’s PLCs, as well as laboratory data for process control and regulatory compliance. The dashboard also tracks five off-site sewer lift stations via MQTT and InfluxDB, dynamically adjusting data resolution for precise second-by-second analysis. With a user-friendly interface and intuitive organization, it provides operators with live KPIs, embedded microscope video analysis, and seamless navigation to detailed historical data dashboards.
This dashboard has become a vital tool for the entire team, enhancing operational efficiency and regulatory compliance by consolidating multiple data sources into a single, accessible platform.
“This dashboard is a great example of how Grafana centralizes data effectively,” one judge said. “I also really like the drill-down feature Grant built for sub-areas and the use of variables to make it easier to explore.”
Clement Poiret: displays equipment effectiveness for manufacturing plants

Clement Poiret developed a Grafana dashboard at Sonceboz to monitor Overall Equipment Effectiveness (OEE) for manufacturing plants, providing real-time insights into production lines and downtime. The dashboard integrates six data sources, including InfluxDB, SQL, and REST APIs, offering a centralized view of production performance. Accessible to production managers, technicians, engineers, and executives, it enhances operational visibility, allowing teams to react quickly to issues and optimize factory performance.
“I found this one really impressive – it’s practically monitoring an entire plant,” one judge pointed out. “The variety of data sources and panels is great, and the live 3D dashboard really stood out to me.”
Pablo Peiretti: tracks cloud infrastructure and app performance
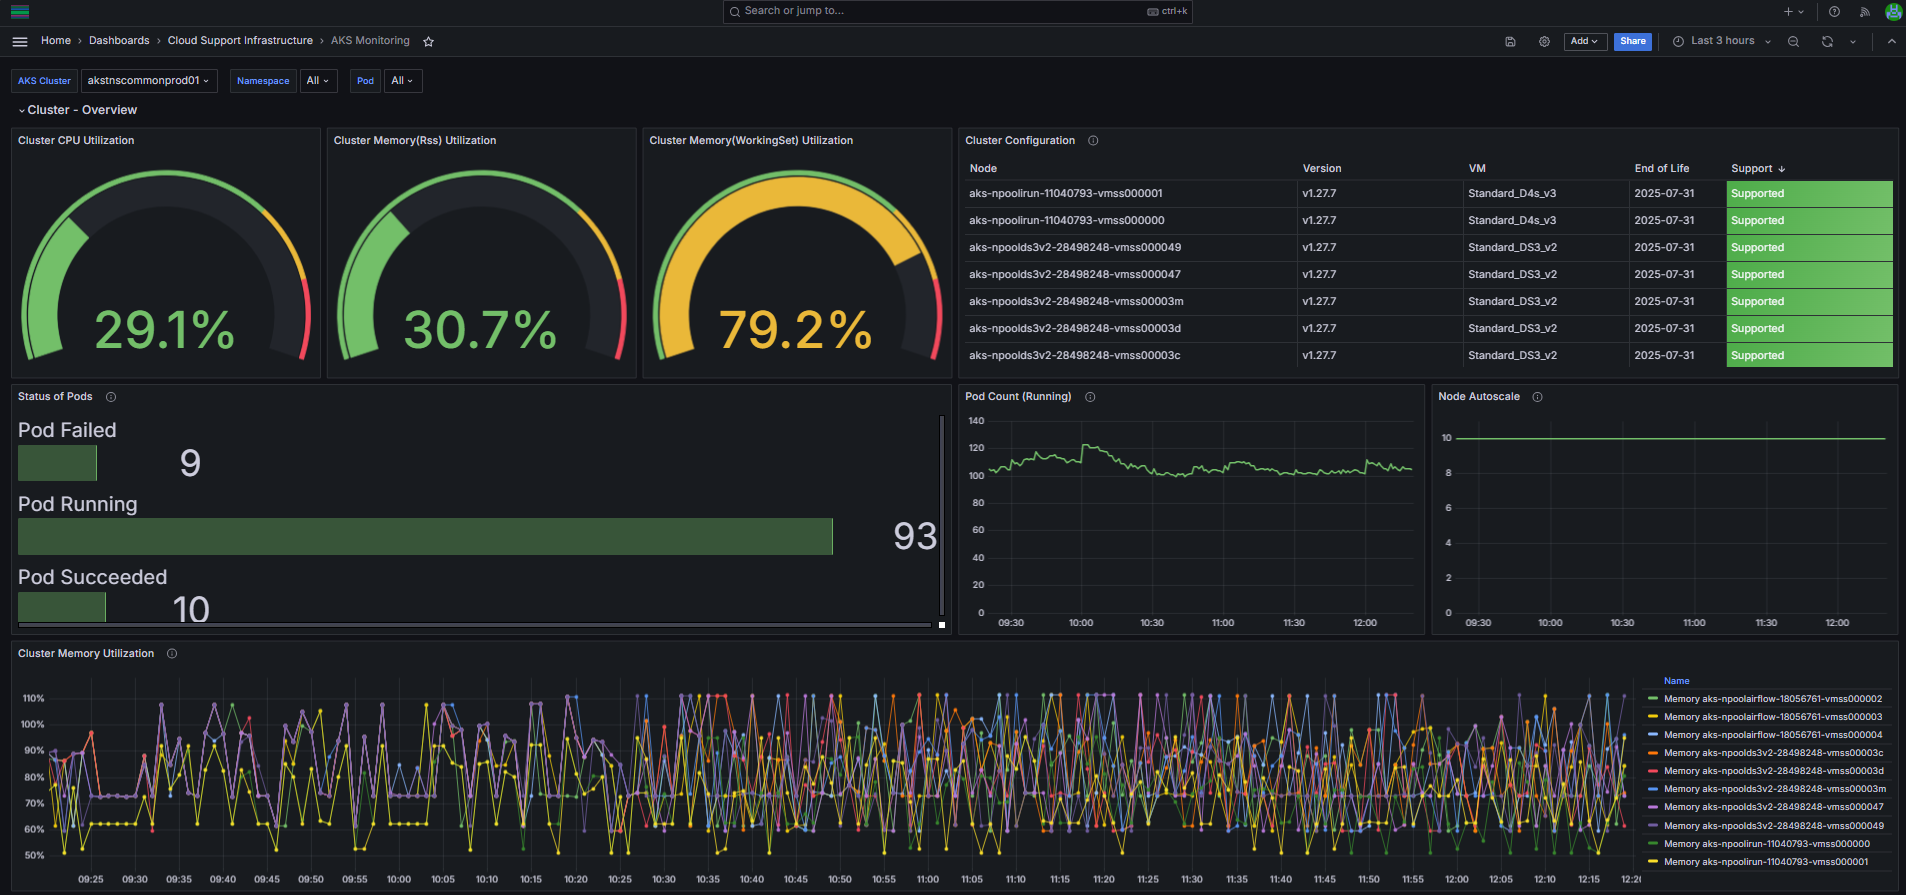
Pablo Peiretti developed a Grafana-based monitoring framework that integrates seamlessly with his company’s cloud ecosystem to automatically track infrastructure and application performance. The system retrieves a catalog of deployed resources and pulls real-time metrics from Azure Monitor, ensuring continuous visibility into his company’s cloud applications. Additionally, Pablo integrated an “End of Life” API into the dashboard to monitor component versions and support status for each of them, enhancing proactive maintenance and compliance.
“I love the story behind this dashboard,” one judge said. “Despite it being a relatively simple dashboard on the surface for monitoring cloud infrastructure, the fact that it has been developed in a way that uses as-code practices really aligns with our current focus here at Grafana, and it has clearly proved to be a massive benefit to Pablo’s organization.”
Kenny Chen: enables issue detection for the EA App
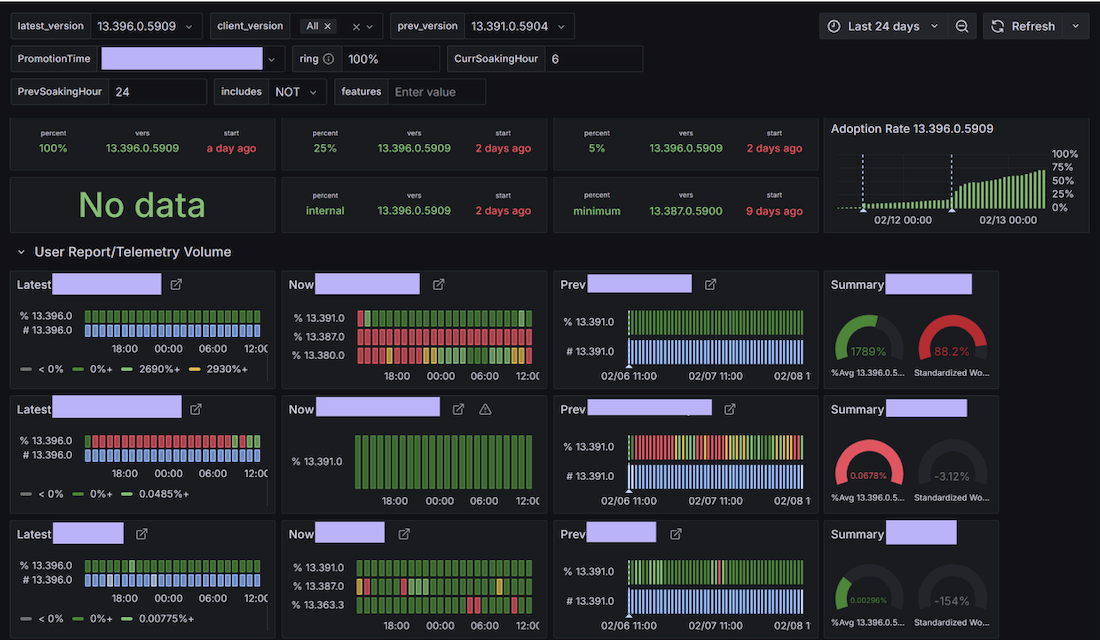
Kenny Chen developed a Grafana dashboard to monitor over 200 core error metrics for the EA App, enabling quick and intuitive issue detection. The dashboard organizes metrics into structured rows, with panels displaying real-time error rates, historical comparisons, and regression analysis across app versions. A key innovation is the color-coded visualization, which simplifies complex data interpretation, allowing teams to quickly assess app health.
This dashboard has significantly improved EA’s ability to detect and respond to issues, reducing identification time from weeks to hours while preventing critical errors from reaching users. This streamlined approach fosters a culture of data-driven decision-making, empowering developers to take full ownership of live app performance.
“This is a really well-designed dashboard, using color-coding to quickly convey the status of the system,” a judge said. “Even with hundreds of metrics, Kenny managed to keep everything intuitive, making it easy to look at the dashboard and immediately know if something’s off.”
Brian Davis: monitors replication lag in a web portal database
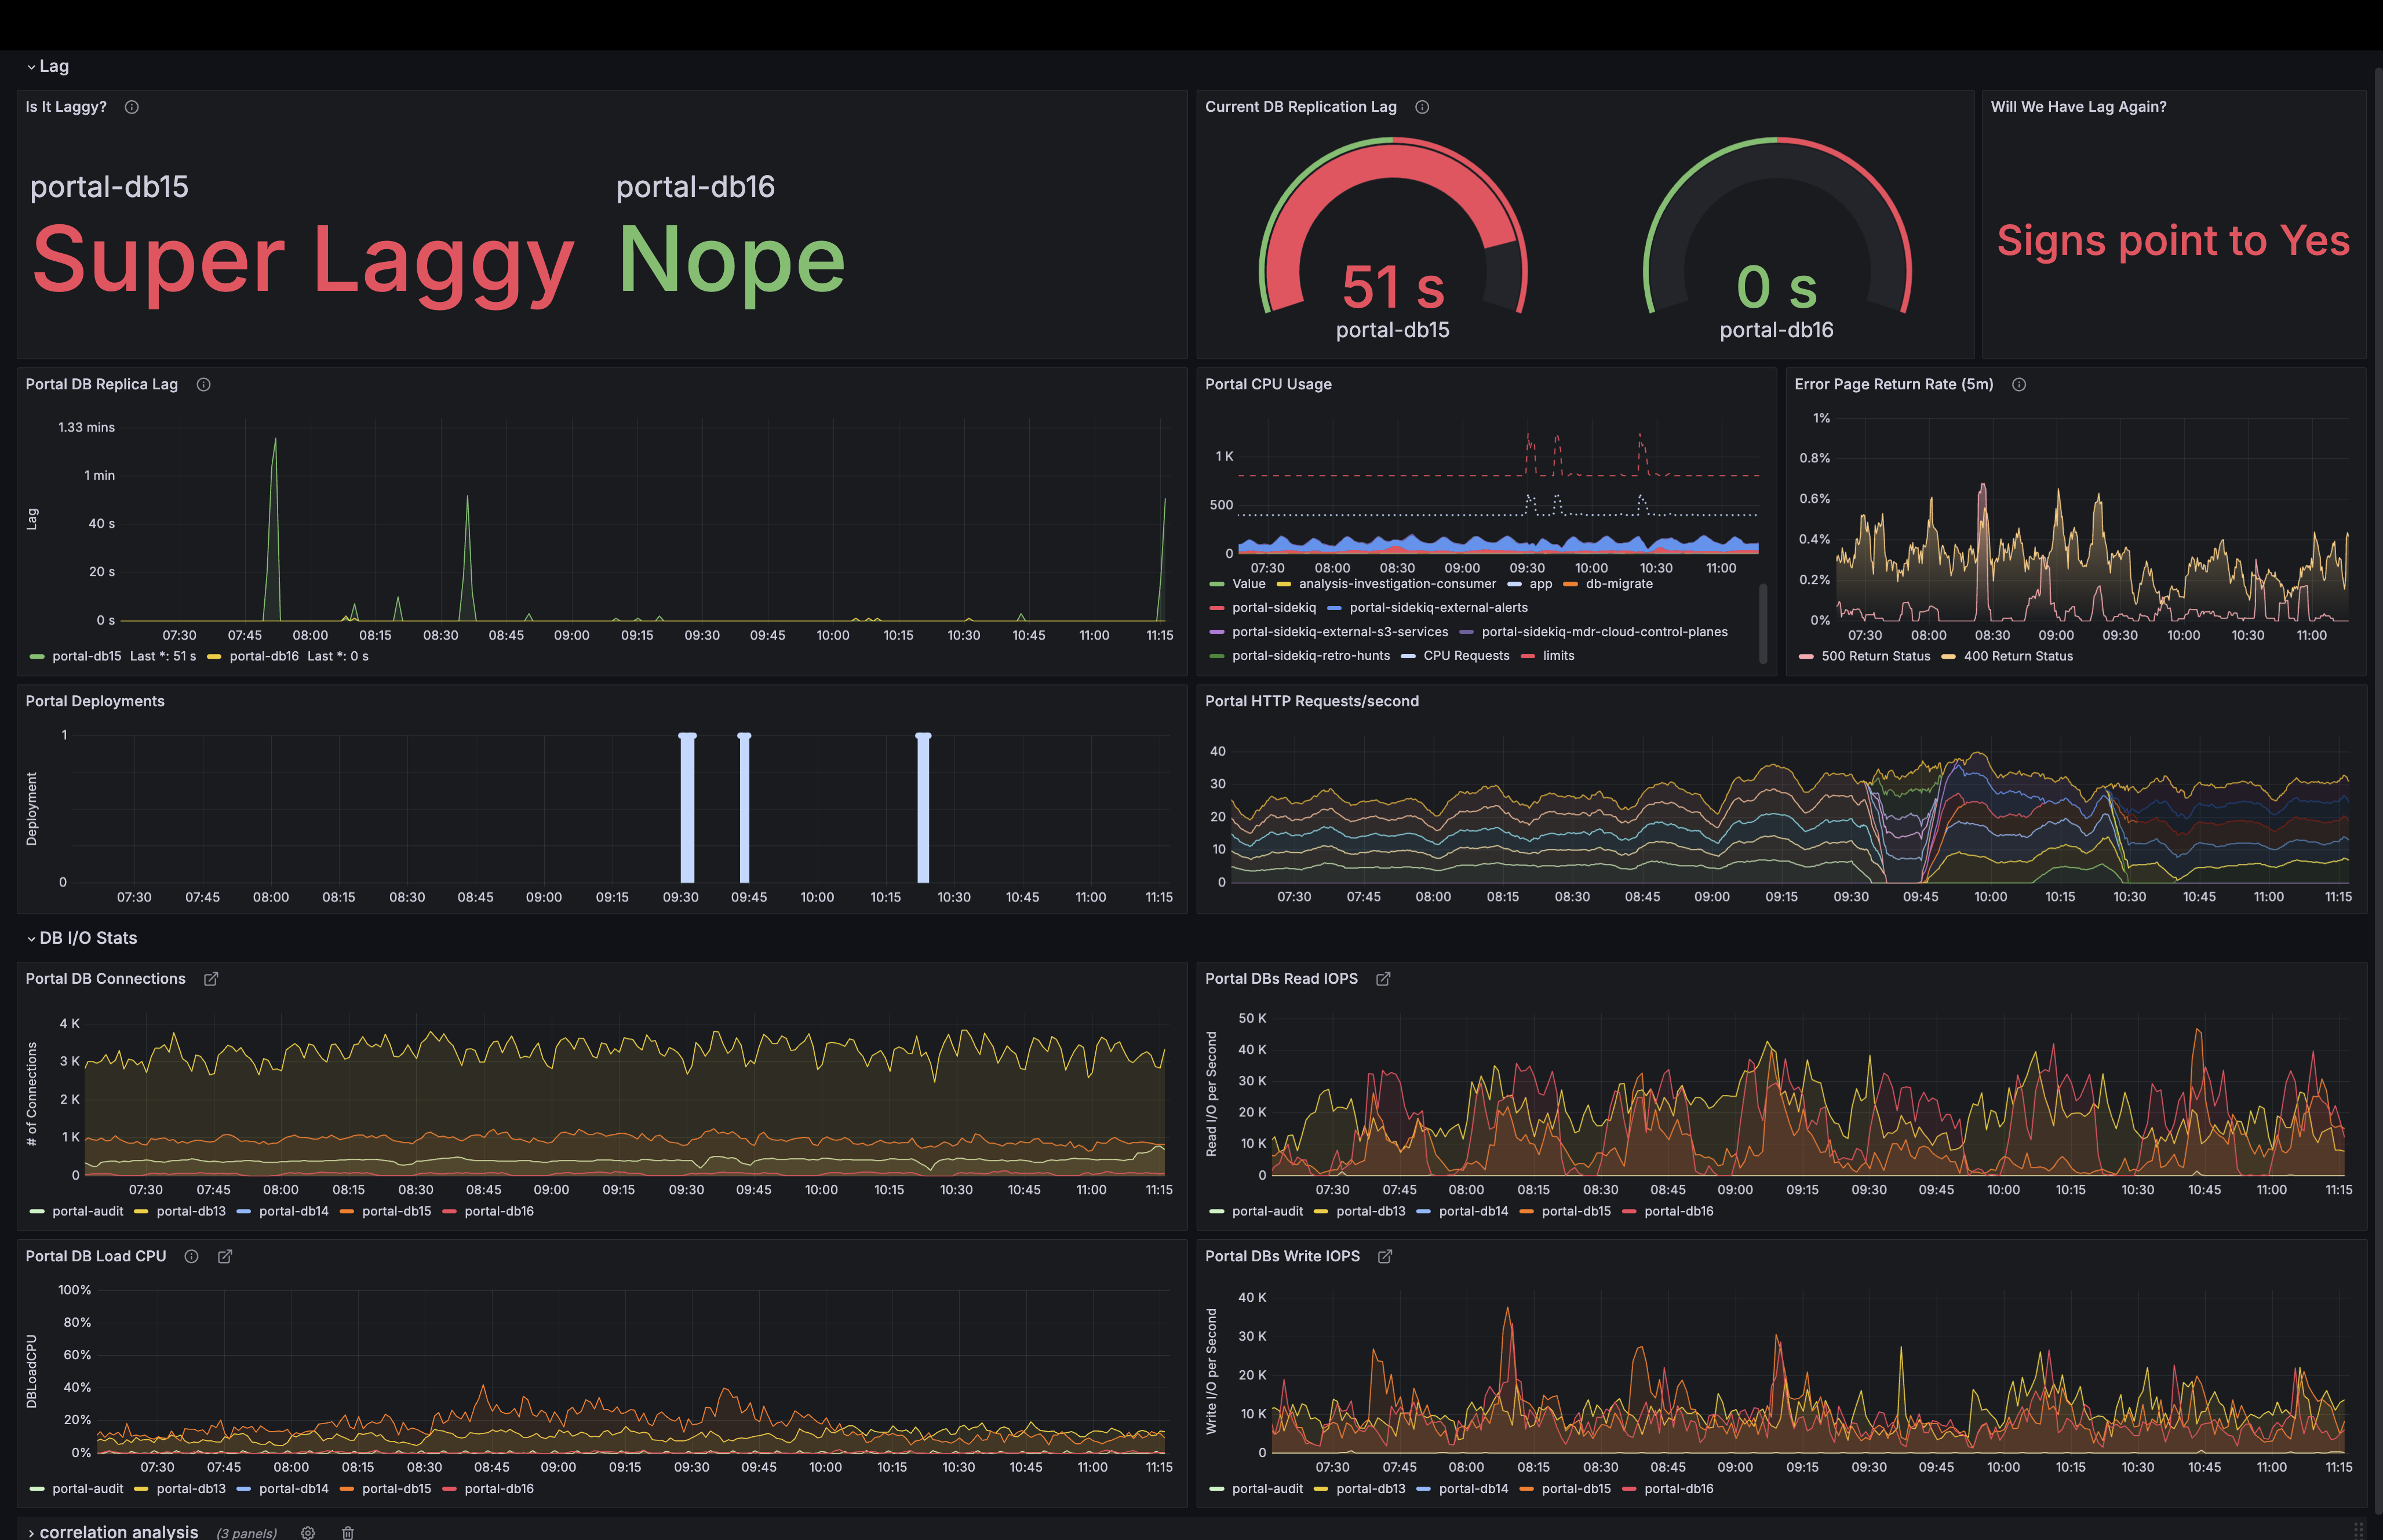
Brian Davis created this dashboard to monitor replication lag in Red Canary’s primary web portal database. This issue, which can ripple through the entire application, is now instantly identifiable via a playful yet functional UI (instead of a simple “yes” or “no,” users see responses like “Gettin’ Laggy” or “Super Laggy”).
For those who need deeper insights, the dashboard consolidates data from Amazon CloudWatch and two Prometheus clusters, displaying key metrics such as database load, error rates, CPU usage, deployment history, and HTTP request rates. By bringing all this information into a single view, engineers can quickly correlate trends and pinpoint causes of lag — whether it’s high CPU spikes, increased I/O, or a recent deployment.
“I really like how this dashboard provides simple answers, in big letters, at the top for non-engineers who want to know what’s going on, and more detailed metrics below for engineers to investigate,” noted one judge. “Overall, a good dashboard with a fun story."
Grafana Cloud is the easiest way to get started with metrics, logs, traces, dashboards, and more. We have a generous forever-free tier and plans for every use case. Sign up for free now!