

Grafana 11.3 release: Scenes-powered dashboards, visualization and panel updates, and more
Note: As of Feb. 20, 2025, the Explore apps (Explore Metrics, Explore Logs, Explore Traces, Explore Profiles) are now the Drilldown apps (Metrics Drilldown, Logs Drilldown, Traces Drilldown, Profiles Drilldown).
Roll out the red carpet! Grafana 11.3 is here and marks the general availability of Scenes-powered dashboards, which set the foundation for what we envision the future of Grafana dashboards will be.
But the current state of Grafana dashboards looks pretty awesome as well. The dashboard experience has improved, including the ability to trigger API calls from any canvas element with the new Actions option across many visualizations. There are also recording rules for Grafana-managed alerts and everyone can start using Explore Logs, part of the Explore apps suite in Grafana that was unveiled at ObservabilityCON and that quickly and easily extracts insights from your data — without any complex query languages.
Below are some of the highlights from the latest Grafana release. If you are looking for more details about all the changes in this release, refer to the changelog or the What’s New documentation.

Scenes-powered Grafana dashboards
Generally available in all editions of Grafana
The architecture for Grafana dashboards has migrated to the Scenes library, which provides you with more stable, dynamic, and flexible dashboards. Here are four immediate improvements to Grafana dashboards:
- View mode and Edit mode to efficiently navigate through the dashboard editing process and easily access options like adding a panel or changing settings.
- Template variables and the time range picker will remain visible as you scroll through your dashboard. This is a requested feature that we’re very happy to be able to roll out!
- Timezone parameter in Grafana URL allows sharing dashboards with a selected time zone. With the new time zone URL parameter,
tz, you can ensure that the receiver views the shared dashboard in the intended time zone regardless of their local settings. - Kiosk mode displays dashboard controls when playing a playlist or displaying a dashboard in full screen. If you prefer to hide some or all of these controls during playlist playback, new configuration options lets you choose what controls to display while the playlist is running.
To learn more, read our dashboards documentation. For more details about the above improvements and known limitations, go to our What’s New documentation for Grafana 11.3.
New in visualizations and Grafana dashboards
Auto-formatted table cell values
Generally available in all editions of Grafana
It’s tough to scan long JSON blobs or stack traces in a compact table. As of 11.3, you don’t have to squint — just inspect that cell! We’ve improved the inspect value experience in table visualizations with the addition of tabs in the Inspect value drawer: Plain text and Code editor.
When the Cell inspect value switch is toggled on, clicking the inspect icon in a cell opens the drawer. Grafana automatically detects the type of data in the cell and opens the drawer with the associated tab showing. Bonus: You can switch back and forth between tabs.

For more information, check out our table documentation.
Actions in canvas panel and other visualizations
Experimental in all editions of Grafana
We’ve updated canvas panels so that you can add actions to canvas elements, like opening an issue in GitHub or calling any API. The Selected element configuration now includes a Data links and actions section where you can add actions to elements. Each action can be configured to call an API endpoint.
Actions can also be configured to trigger with a single click. To enable this functionality, select Action under the One-click section in the Selected element data links and actions option.
If there are multiple actions for an element, the first action in the list has the one-click functionality. You can also control the order in which actions are displayed in the tooltip by simply dragging and dropping them.
The actions functionality has also been added for the following visualizations:
- Bar chart
- Candlestick
- Heatmap
- State timeline
- Status history
- Time series
- Trend
- XY chart
To try out this feature, enable the vizActions feature toggle. To learn more, read our canvas panel documentation.
Legend support in bar gauge visualizations
Generally available in all editions of Grafana
Legend support is now available in bar gauge visualizations, which reflects our continued effort to standardize legends and make them available across more panels. You can customize legends by navigating to the Legend section in panel options.
You can also hide names in each bar gauge, since they are redundant to the legend. To do that, in the Name placement option, choose Hidden.

For more about legend options, please refer to our visualizations documentation.
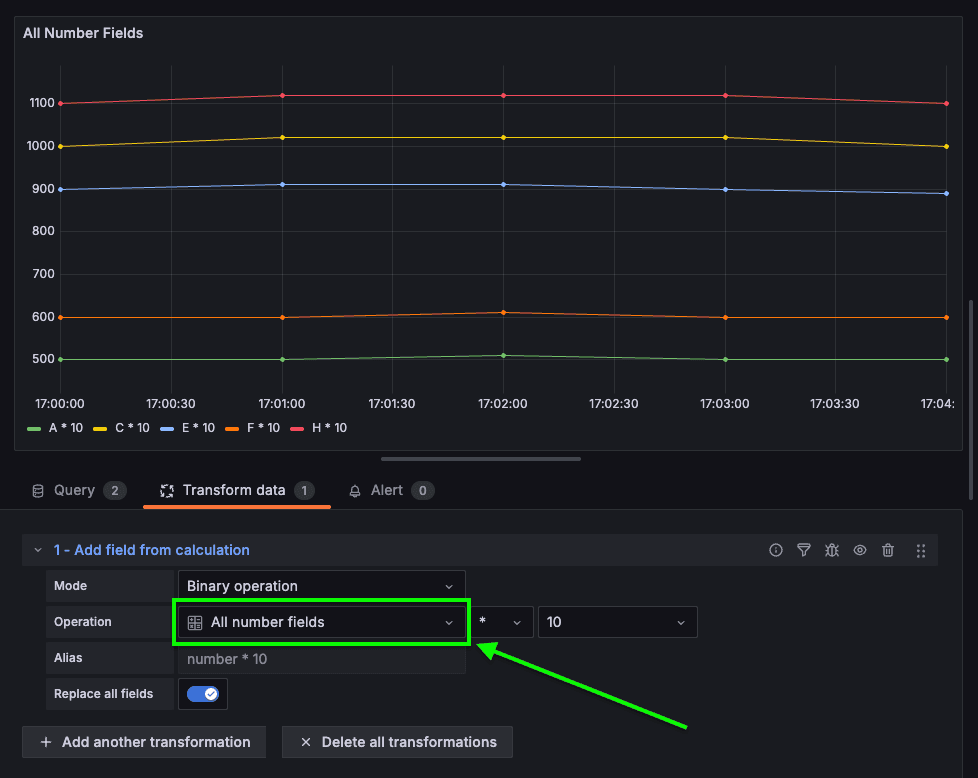
Apply a binary transformation to multiple number fields at once
Generally available in all editions of Grafana
When you set up a binary operation using the Add field from calculation transformation (for example, dividing each column by a certain value), there’s a new All number fields option available to select. You can use this to apply a mathematical operator to multiple number fields simultaneously. This feature is particularly useful when you’re scaling or offsetting data containing multiple dynamically named fields, allowing the transformation to be applied when dealing with unknown field names.
To learn more, dive into our transformation documentation.
Explore Logs available by default
Generally available in all editions of Grafana
With Explore Logs, you can visualize and explore your logs to troubleshoot without having to write any queries. It is now easier than ever to find spikes in your log volume, filter your logs, and pinpoint problematic log lines.
With Grafana 11.3, Explore Logs will be automatically installed in all on-prem instances. You can now use Explore Logs alongside Explore Metrics without needing to install it manually.
This is configured by the preinstall configuration parameter in your Grafana configuration.
For more information about how Explore Logs works, refer to the documentation.

Add correlations to external URLs
Generally available in all editions of Grafana
You can use Correlations to set up links between data sources — for example, clicking on a customer ID in a log line to open up a Salesforce query for that customer in Explore. Previously, the link generated would only be from one query to another, meaning results from a query could only generate links to open a second Explore panel with other query results.
Now you can create correlations that link to any URL. For example, you could link from that customer ID directly to Salesforce itself by inserting that customer ID into the URL. The format follows the standard Grafana format for using variables, just like in data links.

Read all about this feature in our correlations documentation.
Grafana Alerting: all the latest updates
Simplified query section for alert rule creation
Generally available in all editions of Grafana
With Grafana 11.3, you can use a simplified version of the query and alert conditions step to create Grafana-managed alert rules. The default options streamline rule creation with a cleaner header and a single query and condition. For more complex rules, switch to advanced options to add multiple queries and expressions.

To use this feature in Grafana OSS and Grafana Enterprise, you must enable the alertingQueryAndExpressionsStepMode feature toggle. Learn more in our alerting documentation.
Role-based access control for notifications in Grafana Alerting
Available in public preview in Grafana Enterprise and Grafana Cloud
Admins can manage contact points, mute timings, and notification templates through role-based access control (RBAC). You can now choose who can create, edit, and read contact points, mute timings, and notification templates using permissions or fixed roles.
For mute timings and notification templates, you can grant all users all permissions or no permissions. For contact points, you can extend or limit permissions to individual contact points.
Recording rules for Grafana-managed alerts
Generally available in all editions of Grafana
You can create recording rules for Grafana-managed alert rules to calculate frequently needed expressions or computationally expensive expressions in advance and save the result as a new set of time series. As a result, querying this new time series will be faster, especially for dashboards since they query the same expression every time the dashboards refresh. Previously, this functionality was only available for data source-managed alert rules.
In Grafana OSS and Enterprise, you can create both Grafana-managed and data source-managed recording rules if you enable the grafanaManagedRecordingRules feature flag.
To learn more about configuration, check out our alerting documentation.
Announcement banners in Grafana
Available in public preview in Grafana Enterprise and Grafana Cloud
Grafana admins struggle to effectively communicate important updates and maintenance information to their users through traditional channels like email and Slack. Now you can display customized banners within the Grafana interface to ensure critical information is visible in a timely manner. This ensures that all users are immediately informed of important updates, maintenance schedules, compliance info, or other important messages, reducing the likelihood of missed communications and enhancing overall user awareness and engagement.
By default, only administrators can create announcement banners. You can, however, grant permission to users to create announcement banners with role-based access control.
To use the announcement banner in self-managed Grafana, turn on the notificationBanner feature toggle in Grafana 11.3 or newer and navigate in your Grafana instance to Admin > General > Announcement Banner.

The latest in Grafana data sources
GitHub App authentication for the GitHub data source
Generally available in all editions of Grafana
You can enhance security by using a GitHub App to authenticate the GitHub data source. As an alternative to personal access tokens (PATs), GitHub App authentication reduces the risk of over-permissioning.
For more information, refer to the GitHub data source documentation for detailed instructions on setting up GitHub App authentication. You can also refer to our GitHub data source documentation to learn more.
Authentication and authorization
Configure LDAP through the UI
Available in public preview in all editions of Grafana

You can use the new UI to set up your LDAP server as an Identity Provider, which makes the setup process smoother and allows you to quickly confirm that it works properly.
The new user interface makes it much clearer what each option does, and setting up the various configurations is now more transparent. Bonus: You no longer need to restart the Grafana instance for the new settings to take effect.
To use LDAP in the UI, enable the feature toggle ssoSettingsLDAP.
Learn more about Grafana 11.3
For an in-depth list of all the new features in Grafana 11.3, check out our Grafana documentation, the Grafana changelog, or our What’s New documentation.
Join the Grafana Labs community
We invite you to engage with the Grafana Labs community forums. Share your experiences with the new features, discuss best practices, and explore creative ways to integrate these updates into your workflows. Your insights and use cases are invaluable in enriching the Grafana ecosystem.
Upgrade to Grafana 11.3
Download Grafana 11.3 today or experience all the new features by signing up for Grafana Cloud, which offers an actually useful forever-free tier and plans for every use case. Sign up for a free Grafana Cloud account today.
Our Grafana upgrade guide also provides step-by-step instructions for those looking to upgrade from an earlier version to ensure a smooth transition.
A special thanks to our community
We extend our heartfelt gratitude to the Grafana community!
Your contributions, ranging from pull requests to valuable feedback, are crucial in continually enhancing Grafana. And your enthusiasm and dedication inspire us at Grafana Labs to persistently innovate and elevate the Grafana platform.
We’d love to hear your thoughts on the state of observability. Click the button below to take our annual Observability Survey today!
Grafana Cloud is the easiest way to get started with metrics, logs, traces, dashboards, and more. We have a generous forever-free tier and plans for every use case. Sign up for free now!

