
Monitor these Kubernetes signals to help rightsize your fleet
Organizations that run Kubernetes clusters in cloud native environments should do so in a way that’s both operationally efficient and cost effective. However, many organizations don’t prioritize cost optimization until it becomes a pressing need.
This may be due to a directive from senior leadership, a significant scale-up or migration of Kubernetes clusters, or an unexpected surge in the cloud bill. Regardless of the reason, the mandate to reduce cloud costs can be sudden and urgent, pushing teams to scrutinize their resource usage meticulously.
Beyond just the financial implications, there’s also an environmental impact associated with uncontrolled resource usage. Over-provisioned resources contribute to unnecessary energy consumption and carbon emissions, making it imperative for organizations to optimize not just for cost but for sustainability as well.
So, how do we find that optimal balance with our Kubernetes resources? This post will delve into the signals and indicators to watch for, ensuring that your Kubernetes objects are neither starved nor excessively padded.
Finding the middle ground with Kubernetes provisioning
To properly allocate resources in a Kubernetes environment, you have to carefully monitor your setup and make adjustments based on key indicators. Let’s explore the signals that can help us determine whether our Kubernetes resources are over-provisioned or under-provisioned.
Indicators of under-provisioning
High CPU or memory utilization
- Node level: When nodes consistently hit 80% - 90% CPU utilization, it may indicate that the resources are under strain. For some types of workloads—like a non-spiky, non-SLA workload—this would be completely fine. However, this high utilization typically suggests that the nodes are working at or near their capacity, leaving little room for additional workloads or spikes in demand. The same goes for memory resources.
- Pod level: When pods experience CPU throttling, it can severely impact application performance. CPU throttling occurs when CPU usage and requests begin to overload the pod, causing Kubernetes to restrict the CPU cycles available.
High disk I/O
- Node level: High disk read/write latency is a signal of I/O (input/output) bottlenecks. If nodes are consistently experiencing high disk I/O wait times, it could lead to slower data retrieval and storage operations, impacting the performance of all the pods using local disk resources on that node.
- Pod level: When pods experience slow disk performance, it can be an indicator of insufficient disk I/O capacity. Applications relying heavily on disk operations will suffer from delays and performance degradation.
High network latency
- Node level: Network interfaces showing high packet loss or latency are critical signals of under-provisioned network resources. High network latency can slow down communication between services, affecting overall system performance. (Note that some cloud service providers only make higher bandwidth nodes available through VMs with higher CPU, RAM, and disk resources.)
- Pod level: Applications experiencing slow network responses suggest that the pods’ network bandwidth is insufficient. This can lead to poor user experiences and/or SLA violations, especially for applications dependent on real-time data exchange.
Frequent pod evictions
Pods that are evicted often indicate that the cluster cannot support the resource demands of its workloads, leading to instability and service interruptions.
Technically, this is more of an issue of underestimating workload specifications than an under-provisioning problem, with workloads not respecting their specific CPU, memory requests, and limits. Still, it’s relevant to what we’re discussing here, so it’s still worth keeping an eye on.
Slow application performance
Applications showing increased response times or timeout errors typically signal that the resources provided are insufficient to handle the workload. This can lead to poor user experiences and/or SLA violations
Failed deployments and restarts
Pods failing to start, or restarting frequently due to insufficient resources, can disrupt the deployment process and reduce application availability. This instability can hinder development cycles and impact business operations.
Insufficient node capacity
Nodes frequently running out of CPU or memory, causing pods to be stuck in a “pending” status, indicate that the cluster lacks the necessary capacity to handle the current workload. This situation can delay new deployments and scale-up/scale-out operations.
Indicators of over-provisioning
Low CPU or memory utilization
- Node level: Nodes consistently below 20% - 30% CPU utilization suggest that they are over-provisioned. This underutilization means that you are paying for more CPU capacity than needed, leading to wasted resources and higher costs. Likewise for memory resources.
- Pod level: Pods using a small fraction of their allocated CPU also indicate over-provisioning. Allocating more CPU than required can lead to inefficient use of resources and unnecessary expenditure.
Low disk I/O
Low disk read/write operations indicate underutilization of disk resources. This scenario suggests that while you may have sufficient disk capacity, your IOPS are not fully utilized. This can lead to inefficient resource usage and potentially higher costs due to the tiered pricing models of cloud providers.
Low network utilization
Network interfaces showing low bandwidth usage indicate over-provisioned network resources. This underutilization suggests that you are paying for more network capacity than required, leading to unnecessary costs.
High cost without proportional usage
If your cloud costs are higher than your workload demands, it suggests inefficiency. If your cloud bills are high, but the resource utilization is low, it’s a clear sign that you are over-provisioning.
Unused or idle resources
Unused capacity in cluster nodes, persistent volumes, IP addresses, or other resources remaining unused indicate over-provisioning. Unused and idle resources still incur costs, contributing to higher cloud bills without any operational benefit.

Best practices for rightsizing your fleet
To strike the right balance between under and over-provisioning, regular monitoring and adjustment of resource allocations are essential. Here are some best practices to help you optimize your Kubernetes environment.
Regular monitoring
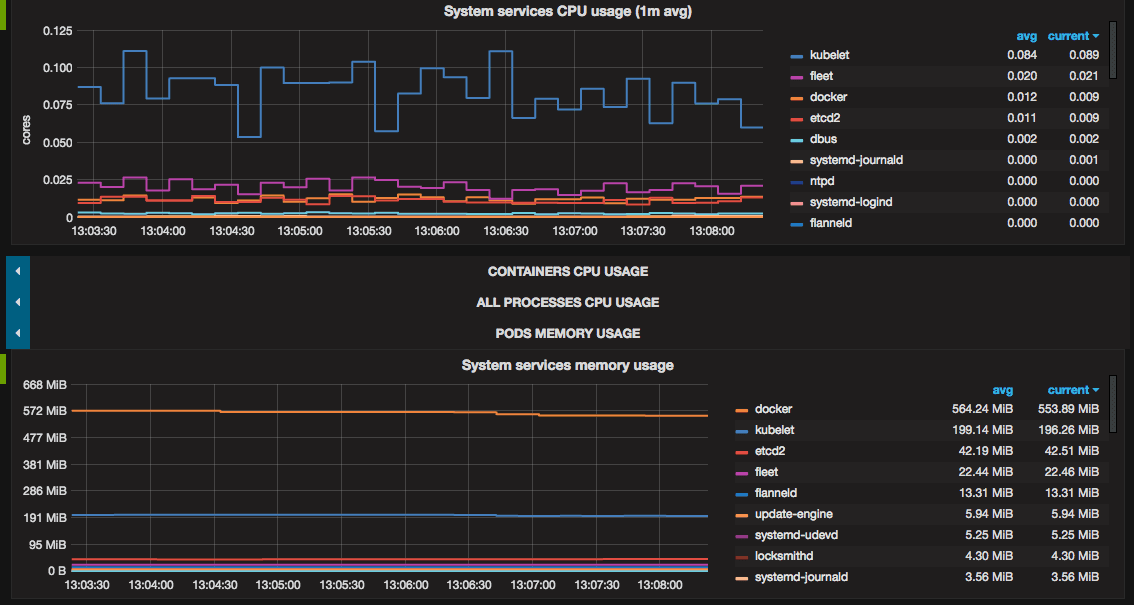
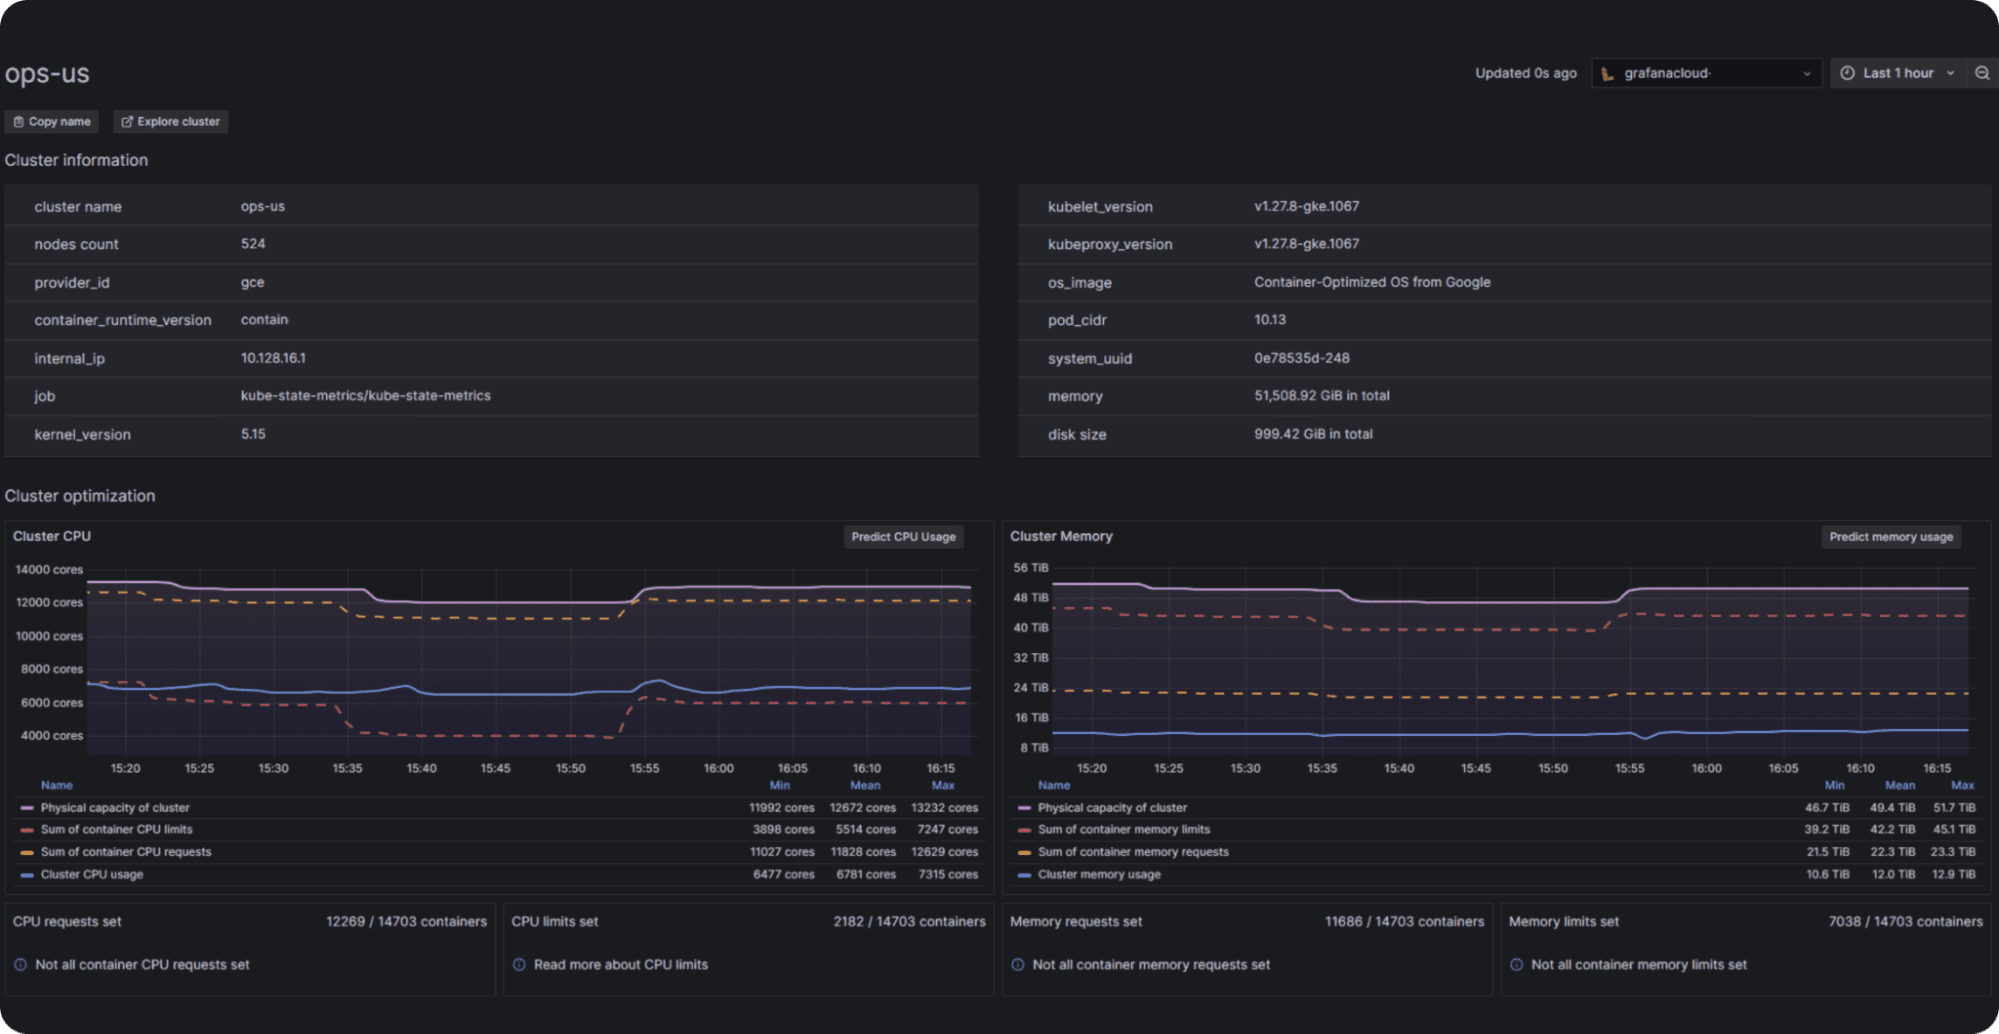
Use tools like Prometheus and Grafana to monitor resource usage. They provide valuable insights into your Kubernetes cluster’s performance and resource utilization, helping you identify areas of inefficiency and make informed decisions about resource allocation. Or, use Grafana Cloud’s Kubernetes Monitoring application for turnkey resource monitoring.

Autoscaling
Implement Horizontal Pod Autoscaler (HPA), Vertical Pod Autoscaler (VPA), and Cluster Autoscaler (CA) to automatically scale resources based on demand. Autoscaling ensures that your cluster can dynamically adjust to workload changes, maintaining optimal resource utilization.
Resource quotas and limits
Set appropriate resource requests and limits for your pods to avoid over- or under-allocation. Defining these limits is critical to ensure that resources are used efficiently and that applications have the necessary capacity to perform well.
Continuously optimize workloads
Analyze workloads to optimize resource allocation and understand workloads’ resource utilization, remove unnecessary processes, and improve application performance. Optimizing workloads over time will lead to better resource utilization and cost savings.
What’s next
By keeping a close eye on the signals of under- and over-provisioning and making informed adjustments, you can reach a happy state in your Kubernetes environment that is both cost-effective and environmentally sustainable. To quickly stand up Kubernetes observability and resource monitoring, try outKubernetes Monitoring in Grafana Cloud.
And check out the second part of this series, where we’ll help you achieve even greater efficiency and cost savings in your Kubernetes clusters.
Grafana Cloudis the easiest way to get started with metrics, logs, traces, dashboards, and more. We have a generous forever-free tier and plans for every use case. Sign up for free now!

