
Auto-instrumenting a Java Spring Boot application for traces and logs using OpenTelemetry and Grafana Tempo
Auto-instrumentation is a subject I have not had much experience with. Here at Grafana Labs, we primarily develop in Go, which doesn’t afford such luxuries. However, there is an enormous amount of interest from the community in Java auto-instrumentation, so I set out to determine what was possible using the shiny new OpenTelemetry auto-instrumentation libraries.
Let’s dig into this technology and see how we can offload traces to Tempo and logs to Loki to create a compelling auto-instrumentation story.
Getting started
So I haven’t professionally developed in Java for over 5 years, there is no Java IDE on my machine, and words like Bean and Tomcat scare me. Where to start? Thankfully I was able to find and fork an existing application that implements a simple RESTful API on top of a relational database. Throughout this post, we will follow this repo, so feel free to clone it and play along at home.
Setting up auto-instrumentation
To auto-instrument the application, I simply need to reference a jar file I downloaded from the OTel repo. I spent some time trying to figure out how to pull the necessary libraries through maven, but did not have luck. If you look closely at the stack.yml file, you will see that the jar file is mounted:
        volumes:
        - ./opentelemetry-javaagent-all.jar:/opentelemetry-javaagent-all.jar
and the appropriate params are passed to the JVM using JAVA_OPTS:
JAVA_OPTS=-javaagent:/opentelemetry-javaagent-all.jar
Finally, we need to tell the OTel library where to push its spans. In our case, we will be using Tempo and the following environment variables:
        environment:
            - OTEL_EXPORTER=otlp_span
            - OTEL_EXPORTER_OTLP_ENDPOINT=tempo:55680
            - OTEL_EXPORTER_OTLP_INSECURE=true
            - OTEL_RESOURCE_ATTRIBUTES=service.name=demo
We will be pushing spans to Tempo using gRPC. We’ve set insecure to true because we don’t have TLS setup on this endpoint. Also, otlp_span is specifically telling the instrumentation to send data in OTel proto and to send trace data only. Feel free to check the docs for additional configuration options.
Logging?
So Tempo alone is currently a key value store and relies on external systems to index and discover the traces. For this reason we will need some kind of logging in our application that contains the trace id along with other fields so we can easily find our traces. Additionally, we will be pushing these logs to Loki.
Get ready for some Java magic.
First, I added a RequestLoggingFilterConfig because the internet told me to. I made no reference to this file or any other code changes.
Next sprinkle a few more incantations into JAVA_OPTS:
JAVA_OPTS= ...
    -Dlogging.level.org.springframework.web.filter.CommonsRequestLoggingFilter=DEBUG
    '-Dlogging.pattern.console=%d{yyyy-MM-dd HH:mm:ss} - %logger{36} - %msg traceID=%X{traceId} %n'
The first gets the RequestLoggingFilter to log every request as desired, and the second formats the log line to include a trace id.
After I rebuilt the war file with maven, the following log lines began appearing in Loki:
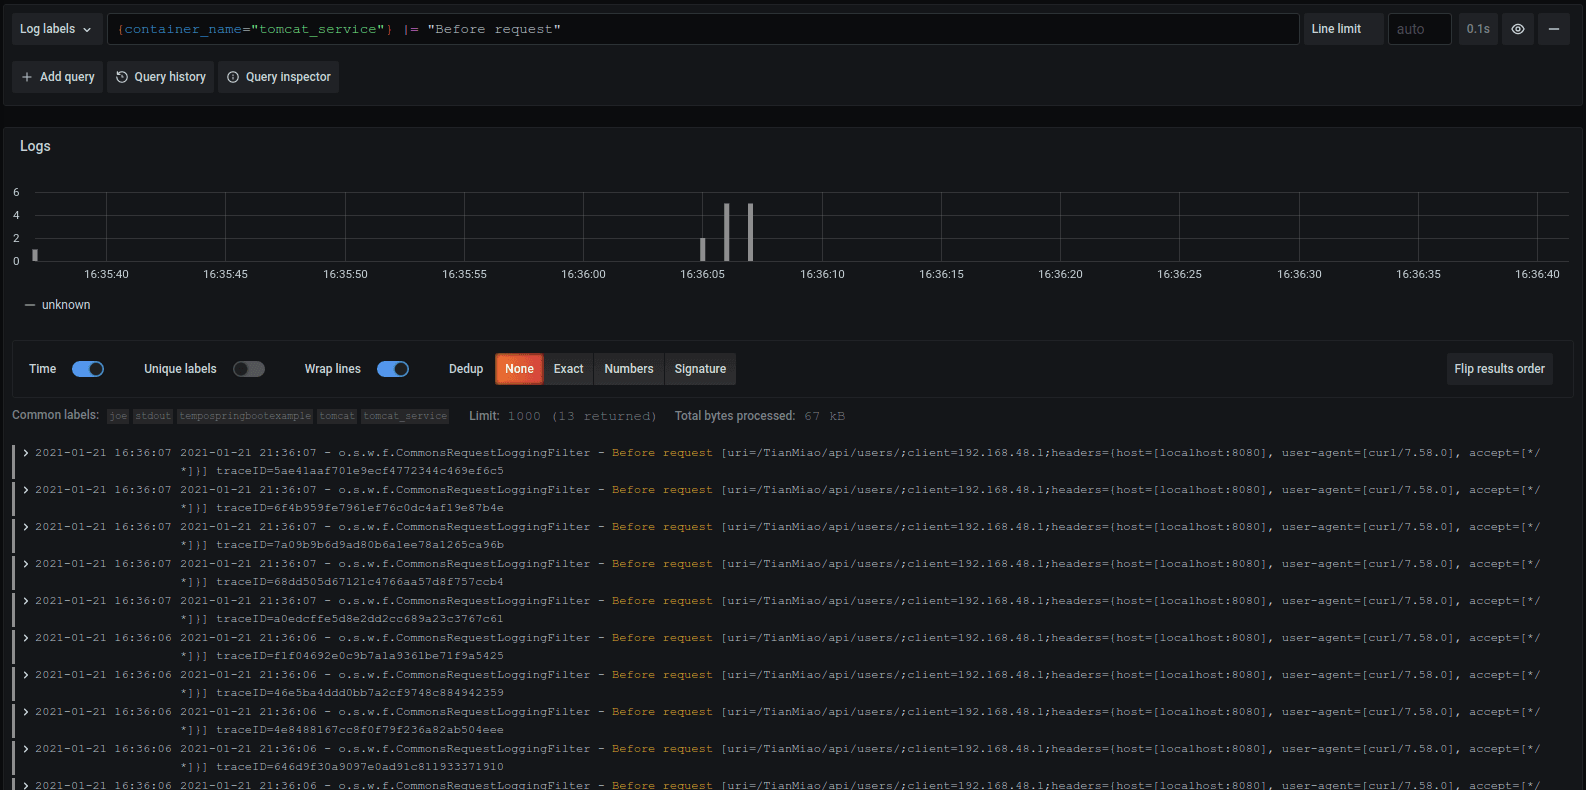
I assume it has something to do with the @Bean or @Configuration annotation. I didn’t ask questions, and Java yielded no answers.
Putting it all together
Now that we have our logs in Loki and our traces in Tempo, we can easily search for traces and then jump directly to them via a handy link in Grafana:
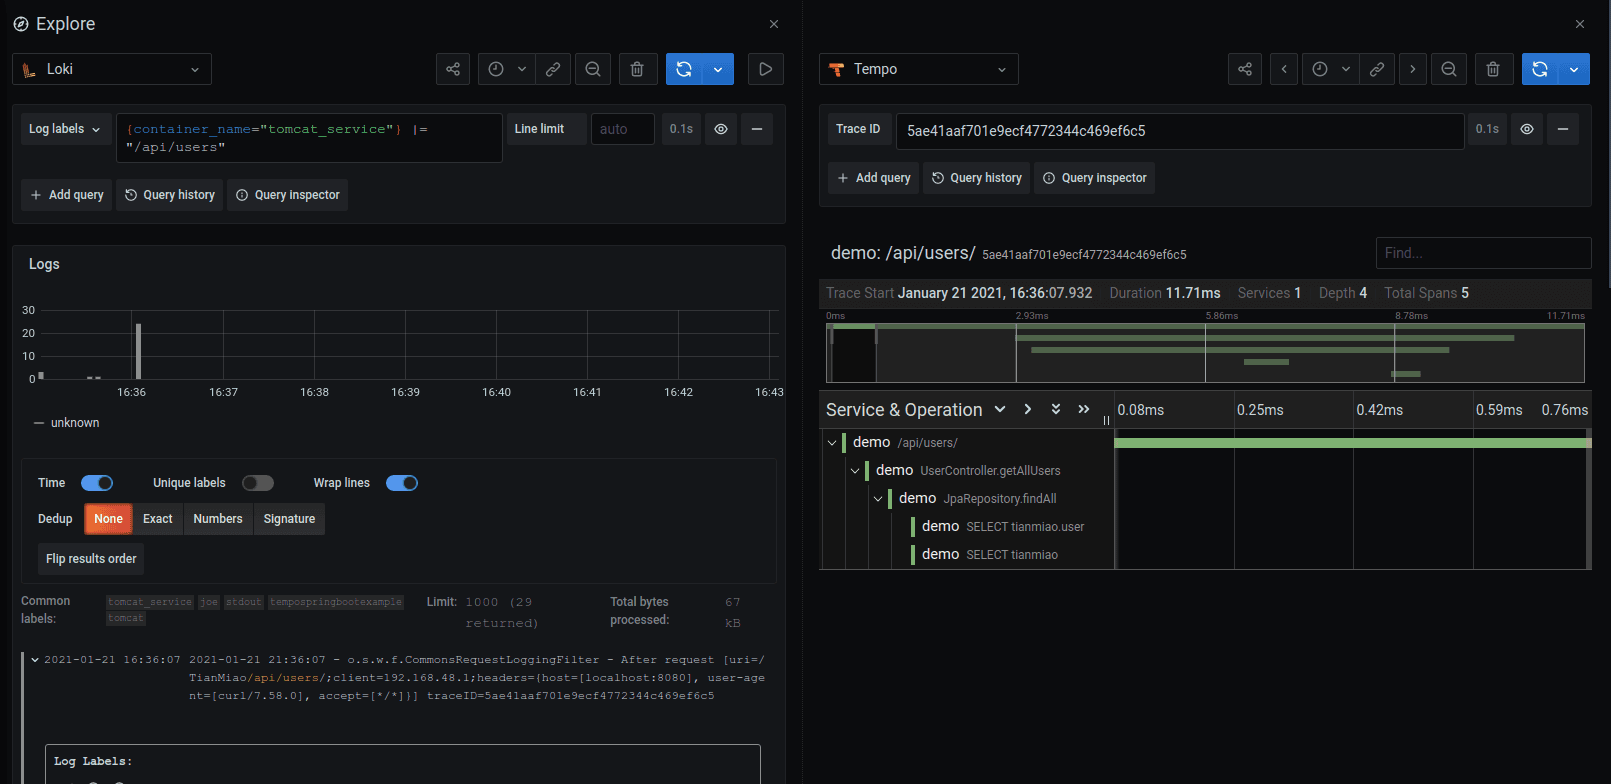
Looking closer at the trace, we can see valuable information such as the path requested and the query executed. Nice work, OTel Java folks!

Future work
As cool as this is, we can do even better! If you look closely at the Loki query, it is simply filtering by path:
{container_name="tomcat_service"} |= "/api/users"
If we had built a custom request logger, we could have logged a number of fields in logfmt that would make Loki very happy. Using new extensions to LogQL, we could have written queries like:
{container_name="tomcat_service"} | logfmt | path = “/api/users” | duration > 1s
Alas, perhaps another day! Go check out the repo, follow the main readme, and give it a shot yourself!
More on Tempo
To learn more about Tempo, you can watch my webinar, Getting started with tracing and Grafana Tempo, now available on demand. You can also get free open-beta access to Tempo on Grafana Cloud. We have new free and paid Grafana Cloud plans to suit every use case — sign up for free now.

