
How we use the Grafana GitHub plugin to track outstanding pull requests
The GitHub data source
First of all, we’re pleased to announce the first release of the GitHub data source. The source code is available at github.com/grafana/github-datasource. Contributions, feature requests, and bug reports are welcome.
Using the GitHub data source, Grafana users can visualize data from GitHub’s API. Some features include:
- Annotating events like releases, commits, issues, and pull requests.
- Displaying tabular GitHub data.
- Using dashboard variables to monitor different datasets using the same panels, or create repeating panels using multi-value variables.
In this blog, we’ll go over some use cases for this handy plugin.
Scenario
As an organization with popular open source projects, like Grafana, Cortex, Loki, Tanka, and more, it’s easy for pull requests to be submitted and quickly forgotten.
With the GitHub plugin, we can easily track the aging of pull requests.
Using transformations and a SingleStat with the “Average” calculation, we can display 2 key metrics:
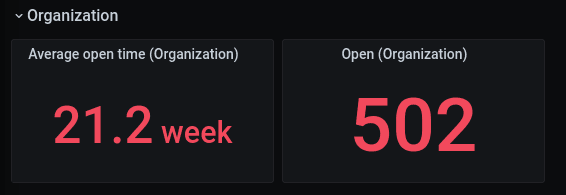
To find the average time a pull request is open in the grafana organization, we can use the query editor with the following options:

- Use the “Pull Requests” query type.
- The “Owner” field can be the name of an organization or a variable. In this example,
$organizationis a variable whose value isgrafana. - By not including a “Repository,” the data source uses GitHub’s search API to search for pull requests across the entire organization.
- “Time Field” will filter results to fit within the time range. For example, if you’re looking for pull requests closed in the last hour, you would set your dashboard time range to “Last 1 hour” and set the “Time field” to “Closed At.”
- In this case, we chose “None” so that the results will not be filtered at all.
- Since we chose the “Singlestat” visualization, we can leave it at the default “Average” calculation, which will display the average open time.
And with the help of the Transformation features in Grafana 7.0+, we can display the number of results as the total number of pull requests in the Grafana organization using the same query as above.
The only difference here is:
- Under the “Transform” tab, select “Add Transformation” and choose the “Reduce” transformation.
- Choose the “Count” calculation to get the total number of results.
The value displayed will be the number of active pull requests in the grafana organization.

This number may not have a significant value to us, as the Grafana organization has several hundreds of projects. With the help of variables, we can make this data more relevant to the dashboard viewer.
Variables
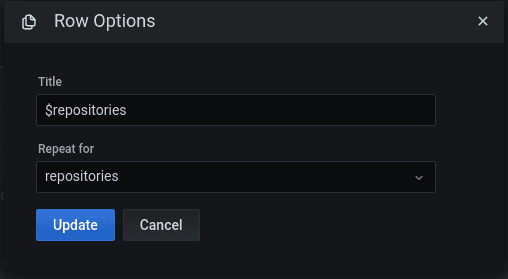
GitHub data can be used as variables. For example, we can create a “Repositories” variable that allows the dashboard viewers to select projects that are relevant to them.

- Under the variables section, create a new variable using your GitHub plugin as the “Data source.”
- Select the repositories query type.
- Define the owner of the repositories.
- Select “name” as the display field.
- This defines what field is used for the variable’s value.
- If you have a lot of repositories, you can use the “Repository” field as search box to filter repositories. It does not have any special syntax; typing in “graf” will show all repositories that have “graf” in them, like “grafana.”

And we can use that variable with repeating rows to show data for the repositories we’ve selected:
And in each panel we use the $repositories variable to display data for each individual repository.
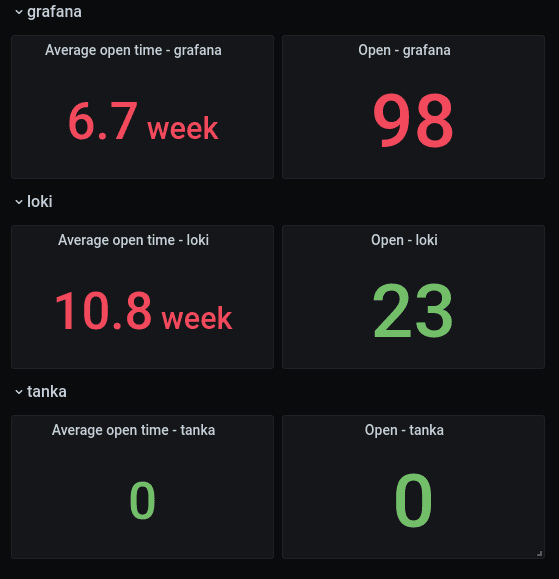
As you’ll see in the “Limitations” section, this data would be even more valuable if we could see trends. Is 6.7 weeks slower or faster than last month?
At the very least, this is information that we have now that we did not have before, and will allow us to be alerted when pull requests start going stale.
Correlating events and metrics with annotations
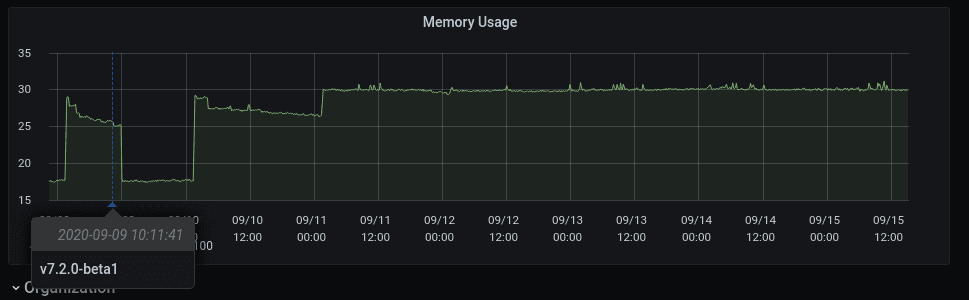
Releases and tags are often used to kick off deployments. In Kubernetes in particular, it is often hard to determine when exactly those events occurred.
With Annotations, you can easily show when a release was pushed, and how it relates to your Prometheus queries.
To create a new annotation using the GitHub data source, it’s not any different than creating a panel query or a variable query.

- In dashboard settings, select “Annotations.”
- Set your query type to “Releases.”
- Set the “Owner” and “Repository.”
- Set the “Display Field” to the value you want to display on the annotation.
- Here we selected “name” because we want to know what version was published when hovering over the annotation on the graph.
- Select the time field. The time field will define where the annotation will display on the graph.
Did a new release cause a spike in memory usage? At a glance it should be easy to tell.
In this example with demo data, if the user was investigating high memory usage, the release would be a pretty clear suspect.
Limitations
Access token limitations
Users should be aware that the GitHub API limits most personal access tokens to 5,000 requests each. Data that is queried that has more than 100 results will result in multiple queries, as all data is paginated.
Therefore, users should be cautious when creating dashboards with several panels. Query caching is enabled on all GitHub plugins.
Historical data
This answers a frequently asked question, “Why is nothing being displayed when using a graph visualization?”
Problems:
- Currently,
pluginsin the Grafana ecosystem are simply an interface to some other resource. The plugins (or data sources) themselves are not intended to store data. - The GitHub API limits access tokens to 5,000 requests each.
- The GitHub API has a pagination limit of 100 results.
In order to get valuable historical data, like the number of commits per user, we must request every commit in a repository, and paginate and process through the results.
In the Grafana repository, there are over 26,000 commits. For our users, this means:
- 260 pages, 260 sequential API requests, or
- ~5% of our user’s hourly allowance.
With one query!
While there is a lot of valuable data in the GitHub API, not all of it may be feasible to display without some kind of intermediate storage.
Time series data
The GitHub API does not provide much, if any, meaningful time series data. In order to plot data like “Number of active pull requests” on a line graph with a running total or count, some form of aggregation needs to take place. This is not currently implemented.
Future plans
- Aggregations: We want users to be able to see historical data and create aggregations on them. While we may have to apply some limitations or figure out some magic to get this to work without completely maxing out an access token, we think it will be possible (and valuable!). See the feature request here: https://github.com/grafana/github-datasource/issues/62.
- Naturally, we want to add a panel/query that allows users to see their current access token’s balance.
- We want to reuse access tokens for users that are using GitHub as an OAuth2 provider for their Grafana instance. This would eliminate the shared access token and reduce the possibility for rate-limiting.
Please try out the plugin and let us know what you think!

