

Grafana 1.5.4 released.
New release today! v1.5.4 is now available for download.
Some small new features and enhancements. Check the download page for a complete changelog.
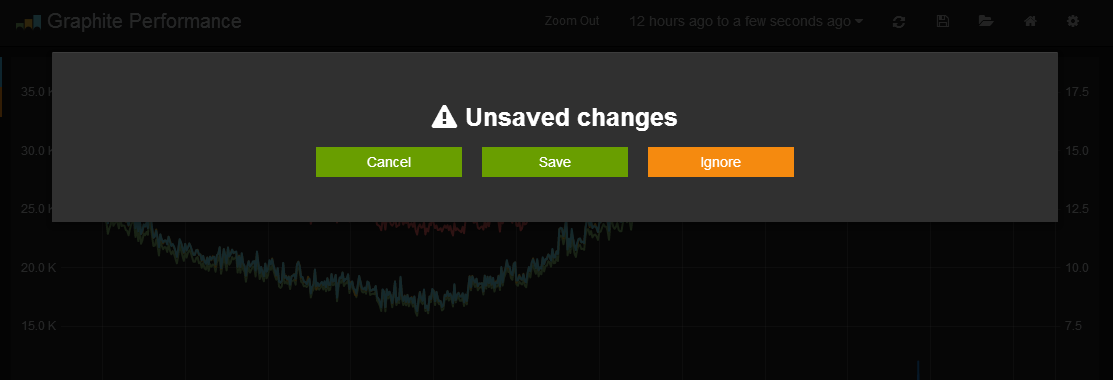
One notable change is the unsaved changes tracking. You now get a warning when moving to another dashboard without having saved your changes, or when you close tab / window.
The progress for bigger new features and improvements has been slow. There are a number of pull requests that are wating for review. Preparation for Monitorama PDX conference talk and the week in US has been the main reason. I have another talk at a conference next week as well which will limit Grafana time. I currently only have evenings and weekends to spend working on Grafana.
After June that will all change. From July and onwards I will be working on Grafana and Grafana related things full time.
If you haven’t noticed there is now a live playground and demo site


