
Important: This documentation is about an older version. It's relevant only to the release noted, many of the features and functions have been updated or replaced. Please view the current version.
Create a dashboard
Dashboards and panels allow you to show your data in visual form. Each panel needs at least one query to display a visualization.
Before you begin:
- Ensure that you have the proper permissions. For more information about permissions, refer to About users and permissions.
- Identify the dashboard to which you want to add the panel.
- Understand the query language of the target data source.
- Ensure that data source for which you are writing a query has been added. For more information about adding a data source, refer to Add a data source if you need instructions.
To create a dashboard:
Click Dashboards in the left-side menu.
Click New and select New Dashboard.
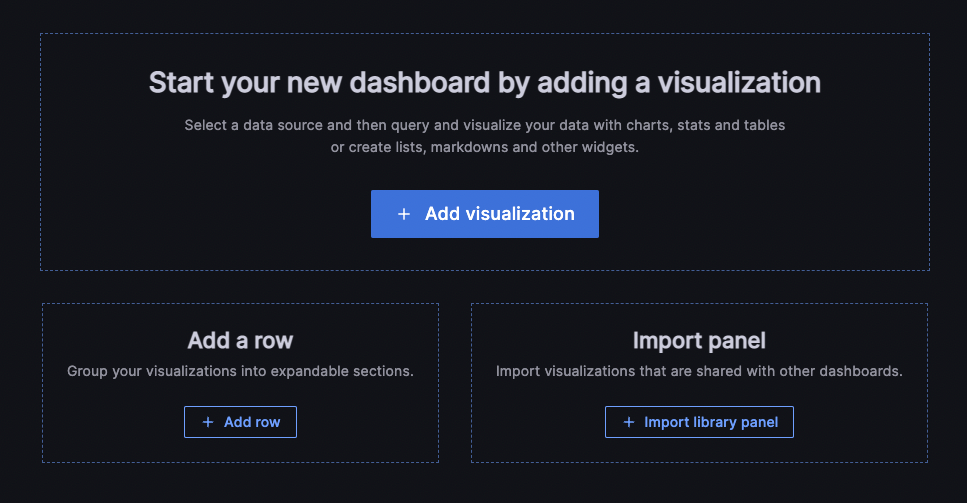
On the empty dashboard, click + Add visualization.
![Empty dashboard state]()
In the modal that opens, do one of the following:
- Select one of your existing data sources.
- Select one of the Grafana’s built-in special data sources.
- Click Configure a new data source to set up a new one (Admins only).
![Select data source modal]()
The Edit panel view opens with your data source selected. You can change the panel data source later using the dropdown in the Query tab of the panel editor if needed.
For more information about data sources, refer to Data sources for specific guidelines.
Write or construct a query in the query language of your data source.
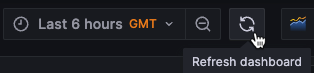
Click the Refresh dashboard icon to query the data source.
![Refresh dashboard icon]()
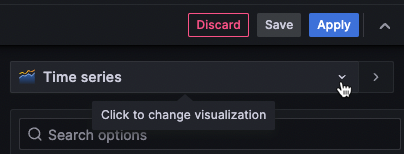
In the visualization list, select a visualization type.
![Visualization selector]()
Grafana displays a preview of your query results with the visualization applied.
For more information about individual visualizations, refer to Visualizations options.
Refer to the following documentation for ways you can adjust panel settings.
While not required, most visualizations need some adjustment before they properly display the information that you need.
When you’ve finished editing your panel, click Save to save the dashboard.
Alternatively, click Apply if you want to see your changes applied to the dashboard first. Then click the save icon in the dashboard header.
Enter a name for your dashboard and select a folder, if applicable.
Click Save.
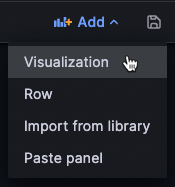
To add more panels to the dashboard, click Add in the dashboard header and select Visualization in the dropdown.
![Add dropdown]()
When you add additional panels to the dashboard, you’re taken straight to the Edit panel view.

Configure repeating rows
You can configure Grafana to dynamically add panels or rows to a dashboard based on the value of a variable. Variables dynamically change your queries across all rows in a dashboard. For more information about repeating panels, refer to Configure repeating panels.
To see an example of repeating rows, refer to Dashboard with repeating rows. The example shows that you can also repeat rows if you have variables set with Multi-value or Include all values selected.
Before you begin:
- Ensure that the query includes a multi-value variable.
To configure repeating rows:
Click Dashboards in the left-side menu.
Navigate to the dashboard you want to work on.
At the top of the dashboard, click Add and select Row in the dropdown.
If the dashboard is empty, you can click the + Add row button in the middle of the dashboard.
Hover over the row title and click the cog icon.
In the Row Options dialog box, add a title and select the variable for which you want to add repeating rows.
Click Update.
Note
To provide context to dashboard users, add the variable to the row title.
Move a panel
You can place a panel on a dashboard in any location.
- Click Dashboards in the left-side menu.
- Navigate to the dashboard you want to work on.
- Click the panel title and drag the panel to the new location.
Resize a panel
You can size a dashboard panel to suits your needs.
- Click Dashboards in the left-side menu.
- Navigate to the dashboard you want to work on.
- To adjust the size of the panel, click and drag the lower-right corner of the panel.
Was this page helpful?
Related resources from Grafana Labs


