Instrumentation Hub: a guided, scalable way to roll out observability coverage without losing controlGrafana AlloyGrafana CloudKubernetes MonitoringApplication observabilityeBPFOpenTelemetry
What's new in the Grafana Image Renderer: higher-quality results, security enhancements, and moreGrafanaGrafana CloudDashboard
Grafana Labs: Top 10 moments of 2025From the launch of Grafana Assistant to the first-ever GrafanaCON Science Fair, there were a lot of big moments for Grafana Labs and our open source community in 2025. Here are some of the highlights.Company news
Grafana 12.3 release: Interactive learning experiences, new and improved logs visualizations, and moreReleaseGrafana
Instrumentation Hub: a guided, scalable way to roll out observability coverage without losing controlGrafana AlloyGrafana CloudKubernetes MonitoringApplication observabilityeBPFOpenTelemetry
Snowflake data visualization: all the latest features to monitor metrics, enhance security, and morePluginsVisualization
Kubernetes Monitoring backend 2.2: better cluster observability through new alert and recording rulesKubernetes MonitoringKubernetes
Enhancing authentication security: Inside Microsoft’s open source contribution to GrafanaSecurityOpen Source
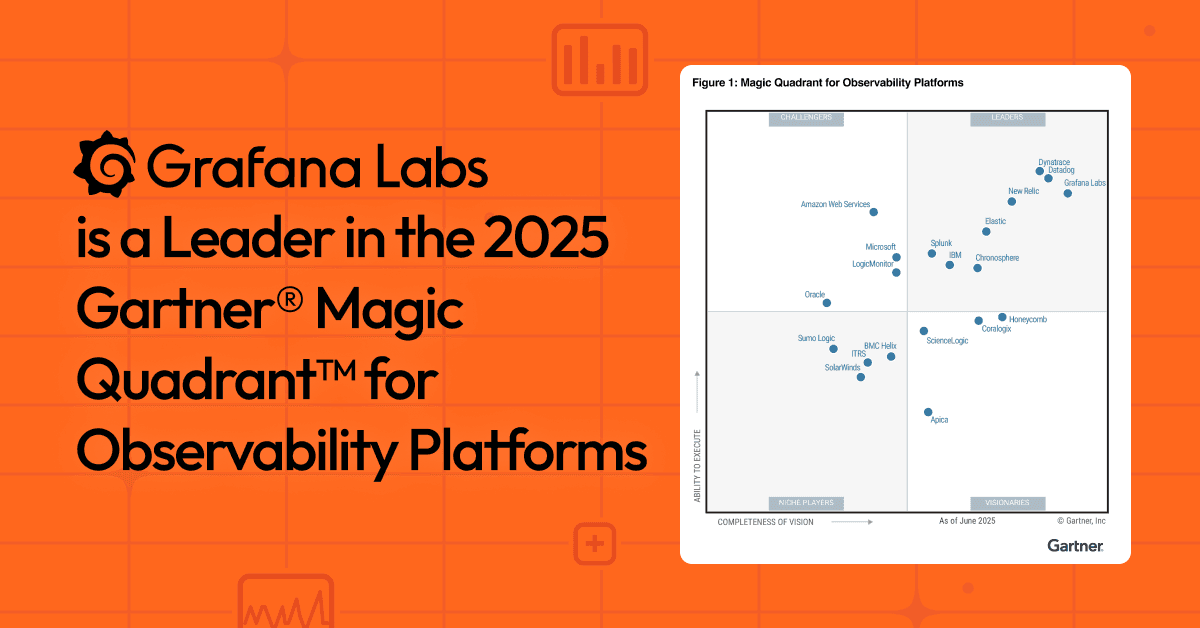
Grafana Labs named a Leader again in the 2025 Gartner® Magic Quadrant™ for Observability PlatformsObservabilityGrafana Cloud
Observability for containerized workloads: How to run Grafana Beyla as a sidecar in Amazon ECSGrafana BeylaGrafana AlloyAWS
From chaos to clarity with Grafana dashboards: How video game company EA monitors 200+ metricsDashboardGrafanaGrafanaCon
Grafana security update: Critical severity security release for CVE-2025-5959, CVE-2025-6554, CVE-2025-6191 and CVE-2025-6192 in Grafana Image Renderer plugin and Synthetic Monitoring AgentSecurity
Faster incident response through distributed tracing: Inside Glovo’s use of Traces DrilldownTracingDrilldown
How Dropbox rebuilt its logging stack with Grafana Loki after a data center went darkLokiLoggingGrafanaCon
Grafana Cloud updates: The latest features in Kubernetes Monitoring, Fleet Management, and moreGrafana Cloud
Grafana Cloud: Manage the AWS Observability app as code with TerraformAWSCloud Provider ObservabilityGrafana Cloud
Going with the flow: How one Golden Grot Awards winner monitors wastewater with GrafanaGolden Grot winnersGolden Grots
How the Factry Historian data source for Grafana enables data-driven insights for factory teamsPluginsCommunityGrafana
Configure and customize Kubernetes Monitoring easier with Alloy OperatorKubernetes MonitoringGrafana Alloy