Hacking for better observability at scale: How Geotab quickly improved their monitoring with GrafanaHackathon
Prometheus native histograms in Grafana Cloud: Get more precision from your Grafana visualizations Grafana CloudPrometheusMimir
Grafana Labs at KubeCon: OpenTelemetry eBPF Instrumentation, Prometheus deep dives, and moreKubeConEvents
Faster, more collaborative data exploration: Introducing saved queries in Grafana CloudGrafana CloudDashboard
Show me the (meeting) money: How to monitor the real-time costs of a meeting in GrafanaGrafanaDashboard
From pillars to rings: How interconnected observability in Grafana Cloud optimizes performance and reduces telemetry wasteGrafana Cloud
Baking in site reliability with observability and AI: How SpotOn uses Grafana Assistant to keep restaurants runningAI
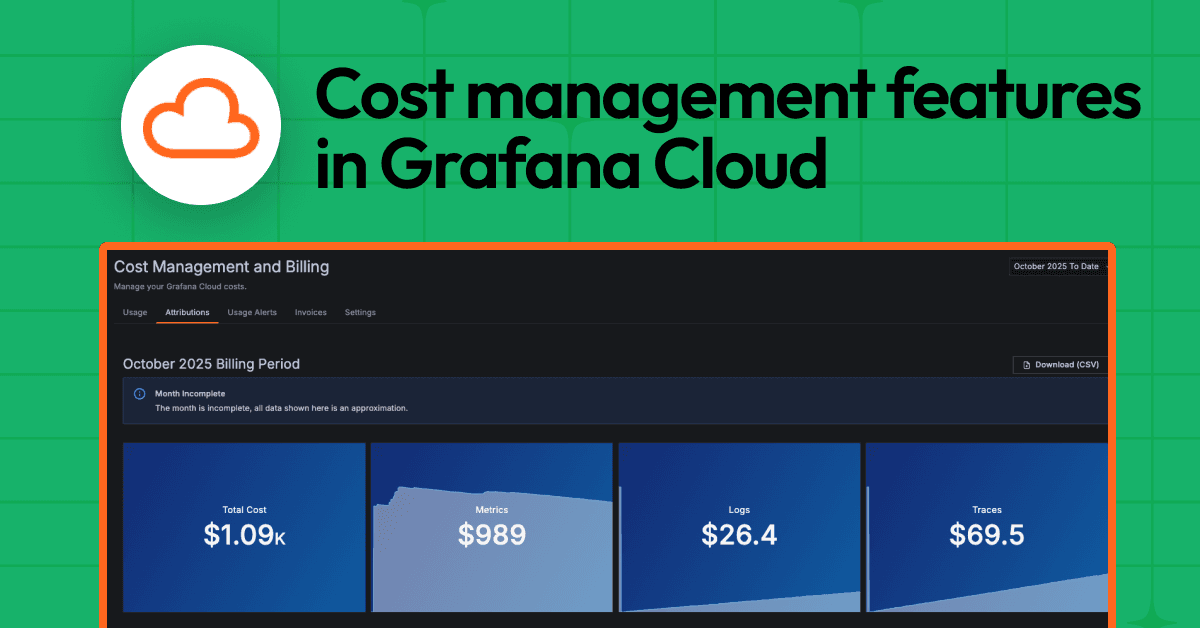
Managing observability costs at scale: A look at the latest cost management features in Grafana Cloud Grafana CloudCost management
Maximize data value and cut costs: Adaptive Telemetry for metrics, logs, traces, and profiles in Grafana CloudGrafana CloudCost managementAdaptive Telemetry
The observability maturity curve: How IT leaders are shifting from tools to outcomesGrafana CloudSLOsAI
Grafana Labs Co-founder Woods: Market maturity, OpenTelemetry, and AI are reshaping observabilityOpenTelemetryAI
Cost attribution in Grafana Cloud: Manage spend across observability and testing workflows Grafana CloudCost managementSynthetic monitoringPerformance Testing
Stop switching tools to find answers: Grafana Assistant now works across 30+ data sourcesAIGrafanaIntegrations
'Grafana's Big Tent' podcast: Anthropic on agentic coding, observability, and the future of software engineeringPodcastsAIObservability
Grafana Labs named a Leader again in the 2026 Gartner® Magic Quadrant™ for Observability PlatformsGrafana Labs has been recognized as a Leader in the 2026 Gartner® Magic Quadrant™ for Observability Platforms for the third consecutive year.ObservabilityGrafana Cloud
Grafana 13.1 release: observability as code updates, extending Grafana Assistant across more data sources, and moreGrafanaRelease