Visualize Salesforce data in Grafana: flexible query options, powerful data correlations, and morePlugins
Secure credential storage for your observability stack: Introducing secrets management in Grafana CloudGrafana Cloud
Grafana Cloud updates: onboard teams with new AI-powered tooling, secrets management for enhanced security, and moreGrafana Cloud
How to monitor Claude usage and costs: introducing the Anthropic integration for Grafana CloudGrafana CloudAI
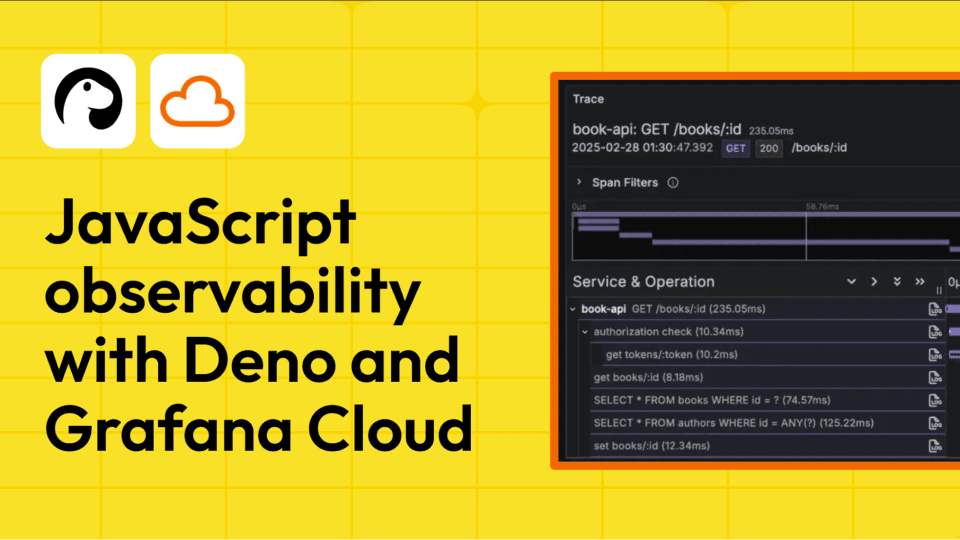
Integrating Deno and Grafana Cloud: How to observe your JavaScript project with zero added codeGrafana Cloud
LLM-powered insights into your tracing data: introducing MCP support in Grafana Cloud TracesGrafana Cloud TracesAI
Learn OpenTelemetry tracing through a grand strategy game: introducing Game of TracesOpenTelemetryTracingGrafana
Deletion protection in Grafana Cloud: a simple way to safeguard your observability stackGrafana Cloud
Building on the foundation of OpenTelemetry eBPF Instrumentation: what’s new in Grafana Beyla 2.5 OpenTelemetryeBPF
Grafana Cloud security update: Grafana Cloud Metrics memory corruption issue resolvedMimirGrafana Cloud Metrics
Cost attribution in Grafana Cloud: Manage spend across observability and testing workflows Grafana CloudCost managementSynthetic monitoringPerformance Testing
Grafana Labs named a Leader again in the 2026 Gartner® Magic Quadrant™ for Observability PlatformsGrafana Labs has been recognized as a Leader in the 2026 Gartner® Magic Quadrant™ for Observability Platforms for the third consecutive year.ObservabilityGrafana Cloud
Grafana 13.1 release: observability as code updates, extending Grafana Assistant across more data sources, and moreGrafanaRelease
Stop switching tools to find answers: Grafana Assistant now works across 30+ data sourcesAIGrafanaIntegrations
'Grafana's Big Tent' podcast: Anthropic on agentic coding, observability, and the future of software engineeringPodcastsAIObservability