How Dropbox rebuilt its logging stack with Grafana Loki after a data center went darkLokiLoggingGrafanaCon
Grafana Cloud updates: The latest features in Kubernetes Monitoring, Fleet Management, and moreGrafana Cloud
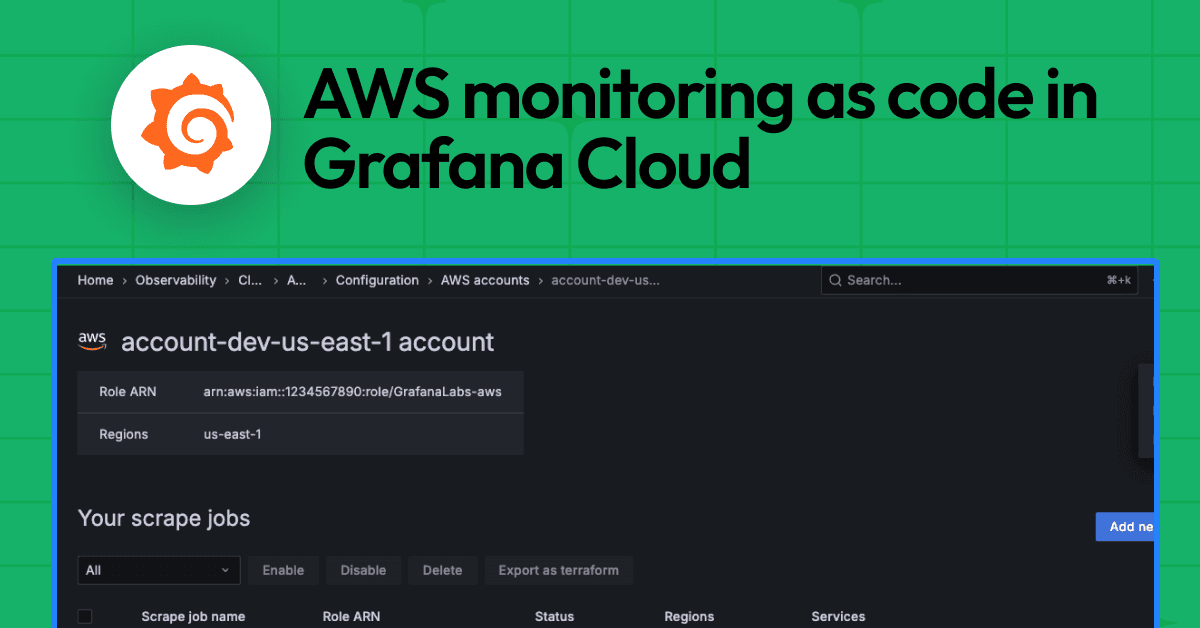
Grafana Cloud: Manage the AWS Observability app as code with TerraformAWSCloud Provider ObservabilityGrafana Cloud
Going with the flow: How one Golden Grot Awards winner monitors wastewater with GrafanaGolden Grot winnersGolden Grots
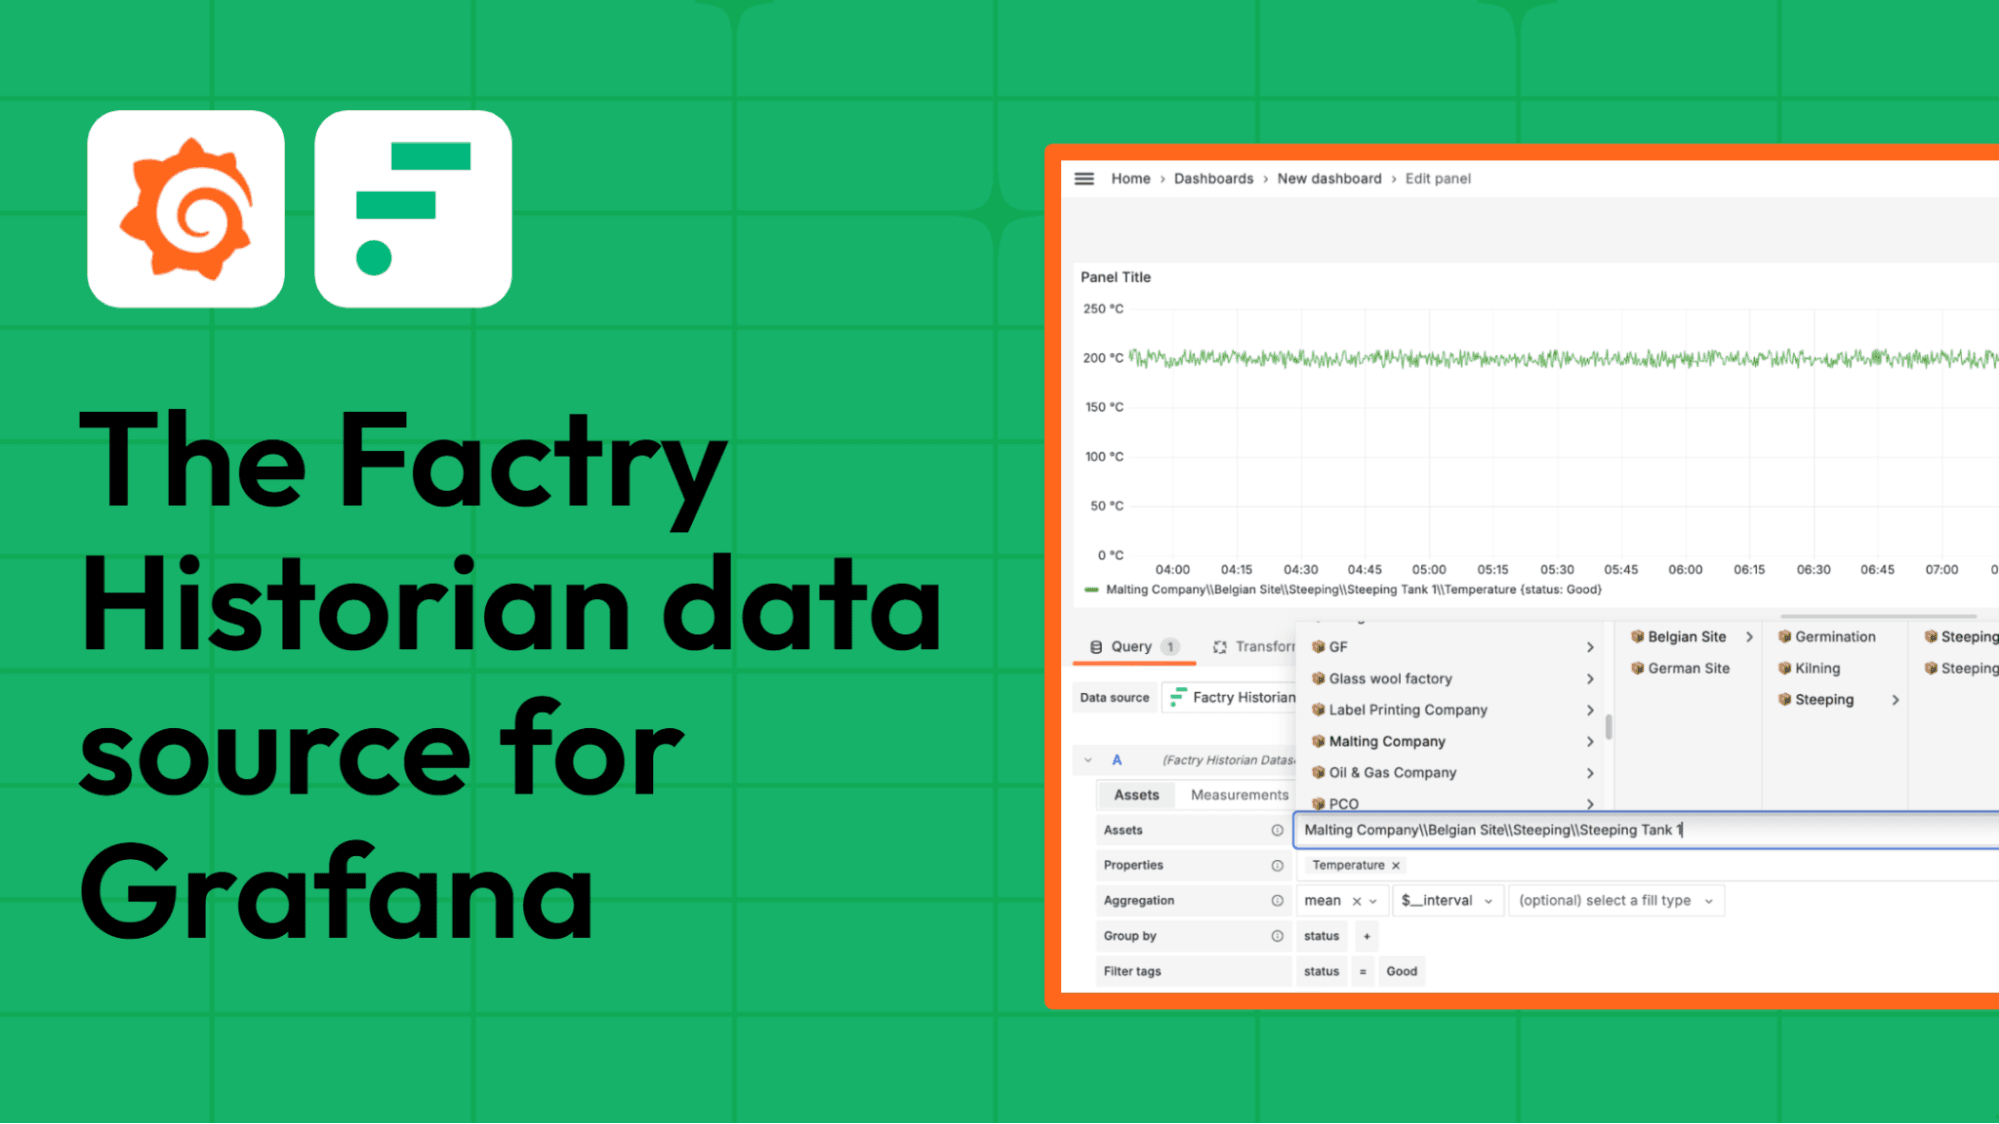
How the Factry Historian data source for Grafana enables data-driven insights for factory teamsPluginsCommunityGrafana
Configure and customize Kubernetes Monitoring easier with Alloy OperatorKubernetes MonitoringGrafana Alloy
Adaptive alerting: faster, better insights with the new metrics forecasting UI in Grafana CloudAIGrafana CloudAlerting
Implementing Grafana Play privacy policies with Grafana k6: A behind-the-scenes lookGrafanaCommunityk6
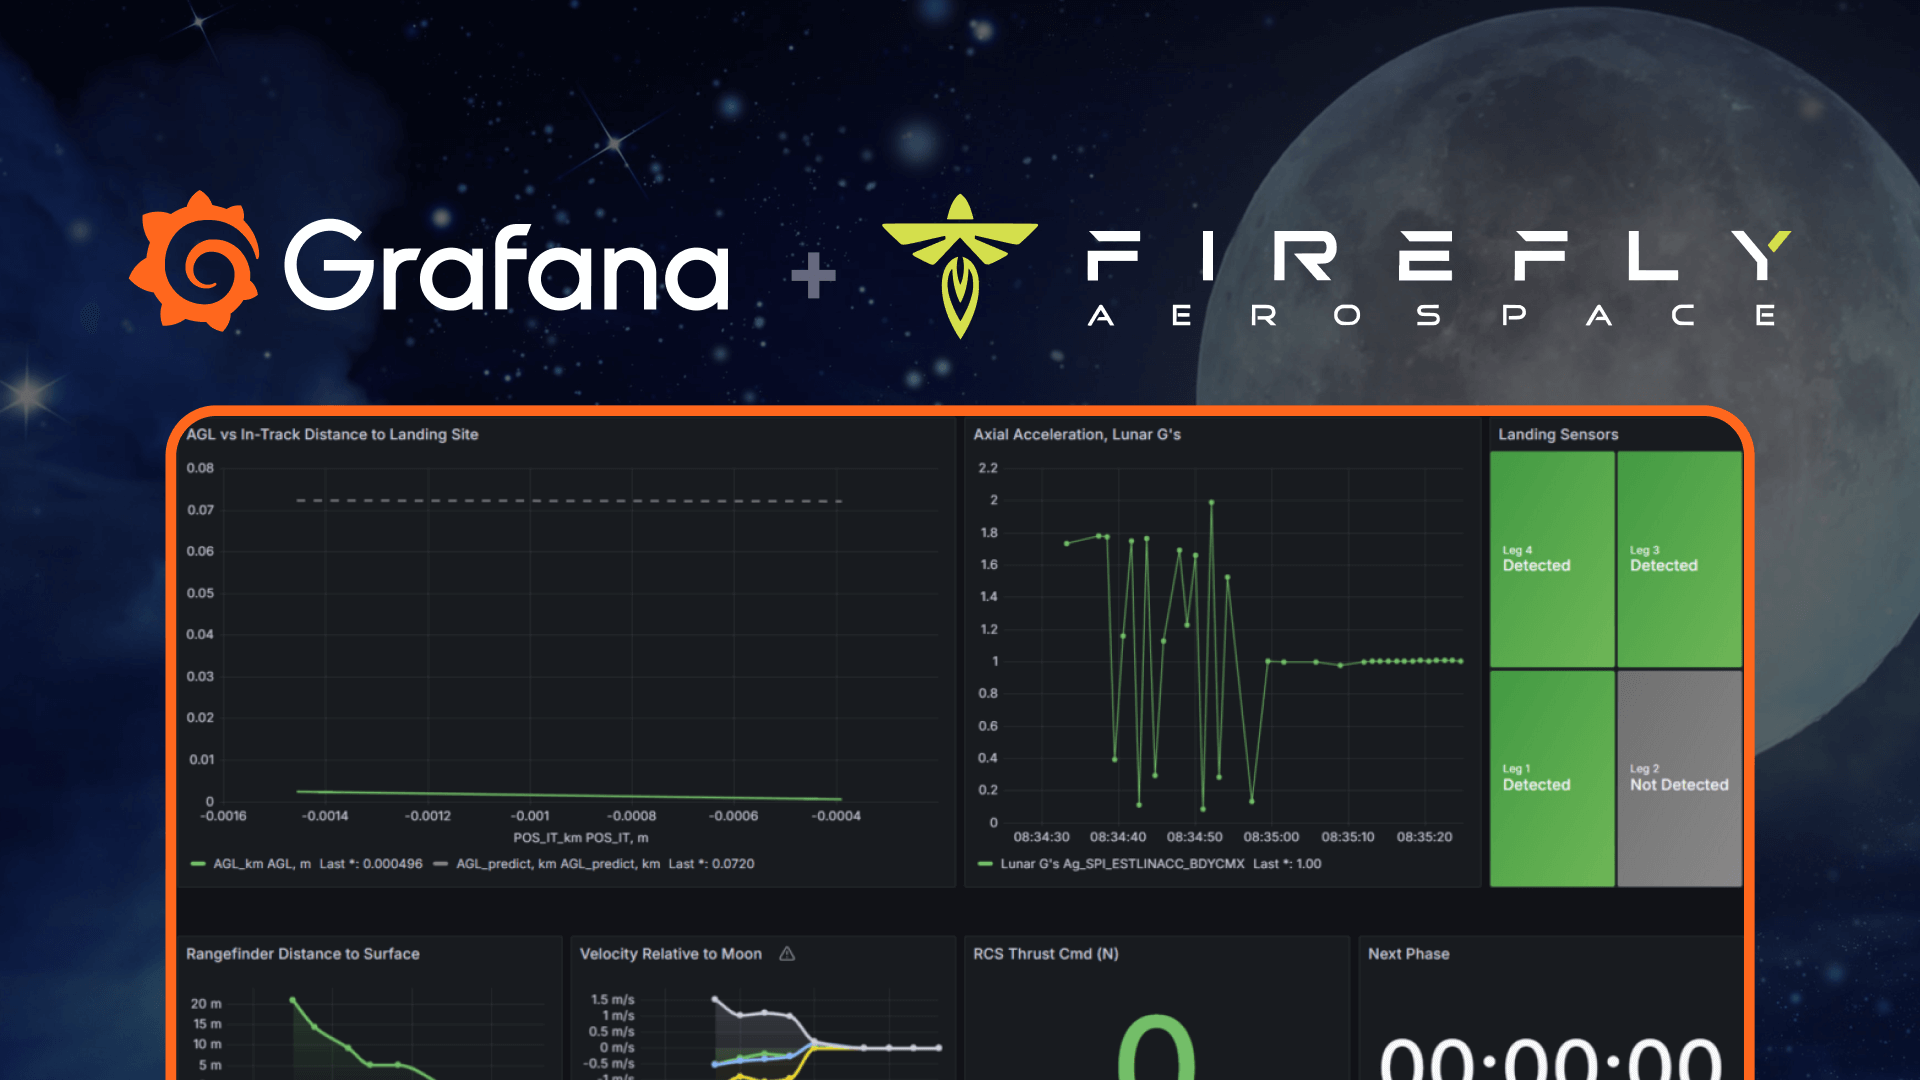
Lunar-level observability: How Firefly Aerospace used Grafana to monitor its historic moon landingCommunityGrafanaConGrafana
Database observability: How OpenTelemetry semantic conventions improve consistency across signalsOpenTelemetry
How to send alerts from Grafana OSS to Grafana Cloud IRMGrafana Cloud IRMGrafanaGrafana EnterpriseGrafana CloudAlerting
Cost attribution in Grafana Cloud: Manage spend across observability and testing workflows Grafana CloudCost managementSynthetic monitoringPerformance Testing
Grafana Labs named a Leader again in the 2026 Gartner® Magic Quadrant™ for Observability PlatformsGrafana Labs has been recognized as a Leader in the 2026 Gartner® Magic Quadrant™ for Observability Platforms for the third consecutive year.ObservabilityGrafana Cloud
Grafana 13.1 release: observability as code updates, extending Grafana Assistant across more data sources, and moreGrafanaRelease
Stop switching tools to find answers: Grafana Assistant now works across 30+ data sourcesAIGrafanaIntegrations
'Grafana's Big Tent' podcast: Anthropic on agentic coding, observability, and the future of software engineeringPodcastsAIObservability