
How Grafana powers the dynamic visualizations of IoT data for AWS IoT TwinMaker
At re:Invent this year, AWS announced its new digital twin service, AWS IoT TwinMaker (in preview), which allows users to create digital twins of real-world systems like buildings, factories, industrial equipment, and production lines.
Using a digital twin to monitor and improve operations for a physical system requires ingesting data from IoT sensors, process instruments, cameras, and enterprise systems, and curating and associating data from these disparate sources. And that’s where Grafana comes in.
We’re proud to share the work we did with AWS IoT TwinMaker. Grafana’s interoperability with a vast range of data sources — which we call our “big tent” philosophy — enables AWS IoT TwinMaker users to organize and visualize the data from their real-world systems, regardless of origin.
In this blog post, we’ll walk through some of the cool features available through the AWS IoT TwinMaker and Grafana integration.
Integration with a variety of sources
Under the hood, Grafana fetches the disparate data from users’ systems, including everything from AWS IoT SiteWise alarms and Amazon Kinesis Video Streams to IoT data that is in SQL, Prometheus, and other sources.
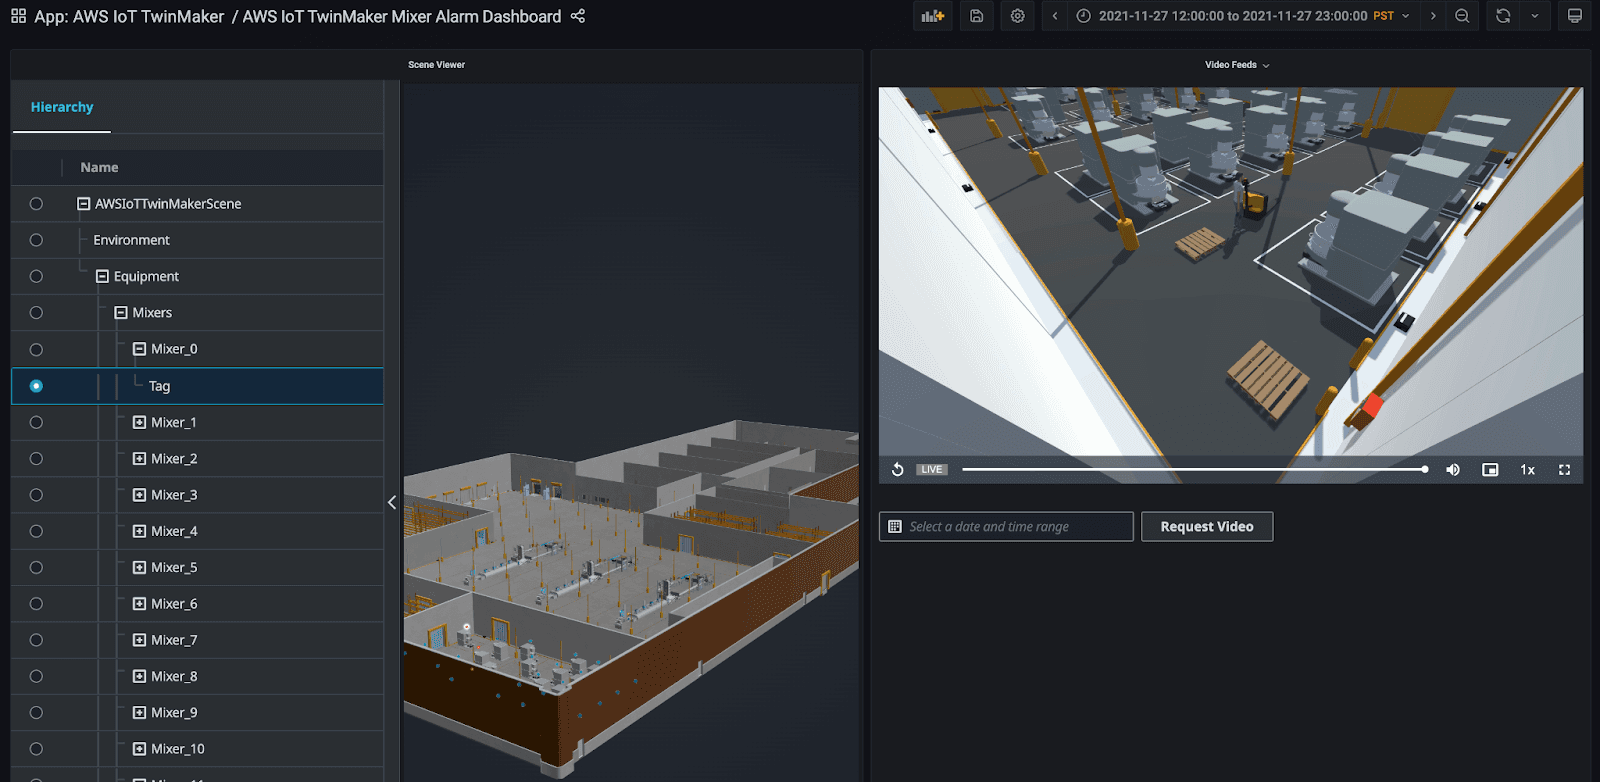
Once the digital twin has been created, developers can use an AWS IoT TwinMaker plugin for Amazon Managed Grafana to create a web-based application that displays the digital twin on the devices that plant operators and maintenance engineers use to monitor and inspect facilities and industrial systems.
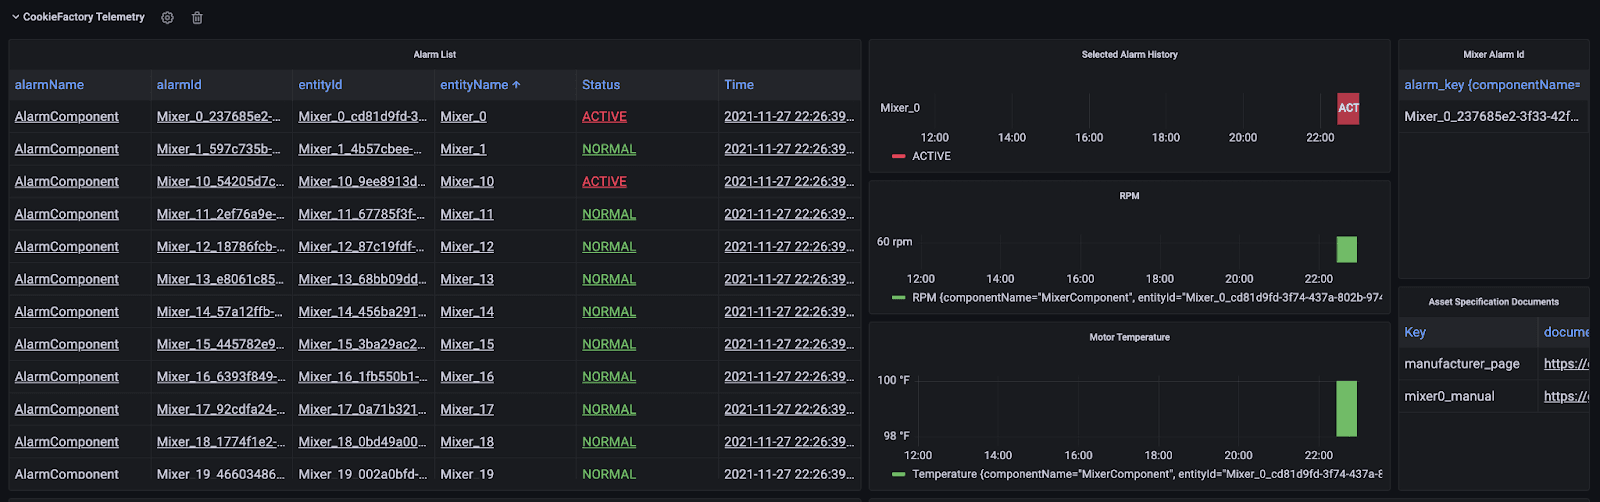
Contextual layouts and visualizations
When navigating through the model in AWS IoT TwinMaker, users zoom in on particular IoT devices and get a Grafana dashboard layout that’s based on what they are looking at.
For instance, in this model of a cookie factory, you can switch between looking at the dashboards tailored for particular mixers or perhaps look for a different motor. Clicking on the devices will change the layouts to show what’s relevant to that particular view.
To learn more about how to create digital twins, check out the AWS IoT TwinMaker documentation and read all about how to get started with the AWS IoT TwinMaker application plugin for Grafana.

