With the new AWS IoT SiteWise plugin, you can visualize and monitor your equipment data in Grafana dashboards
In collaboration with the AWS team, we have just launched another AWS integration, the AWS IoT SiteWise plugin for Grafana.
AWS IoT SiteWise is a managed service that helps users collect, store, organize, and monitor data from industrial equipment, across facilities, at scale. Organizations in the manufacturing, food and beverage, and energy and utilities sectors use AWS IoT SiteWise to compute common industrial performance metrics and create applications that analyze data across industrial equipment at multiple sites.
And now, with this new plugin, users can visualize all of these AWS IoT SiteWise metrics in Grafana, taking full advantage of the wide range of visualization options that Grafana offers, and combine them with other data from multiple sources in a single Grafana dashboard.
Features
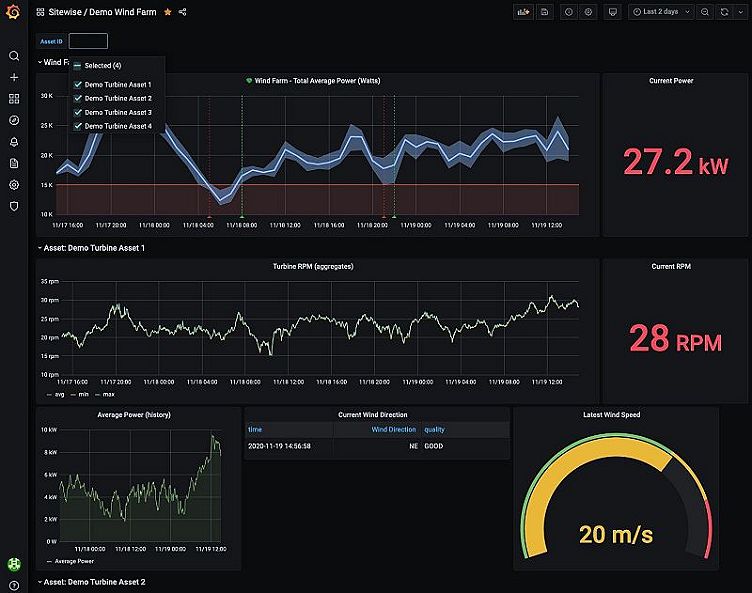
We’ve set up a demo Grafana dashboard for the wind farm example described in the getting-started tutorial in the AWS docs.
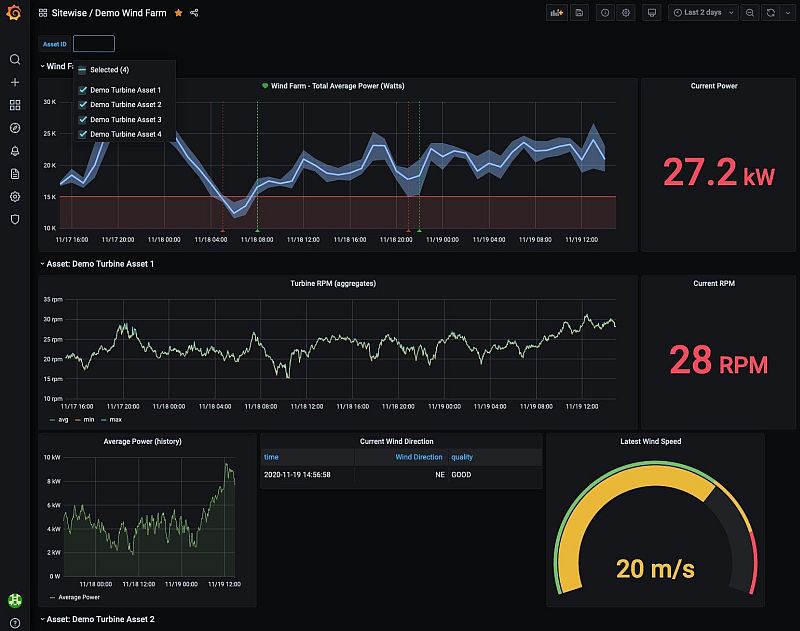
Here, we can take a look at some of the plugin’s features.
Asset browser
The main feature of the AWS IoT SiteWise plugin is the ability to show asset properties and aggregations in Grafana dashboards.
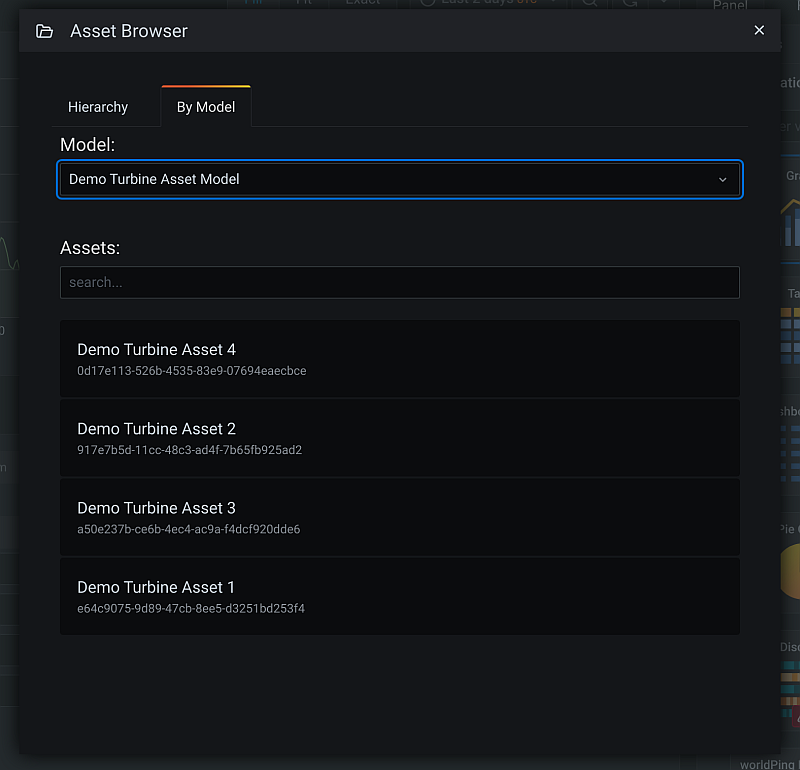
The query editor allows you to pick assets by model (for example, all the instances of a particular type of turbine)…
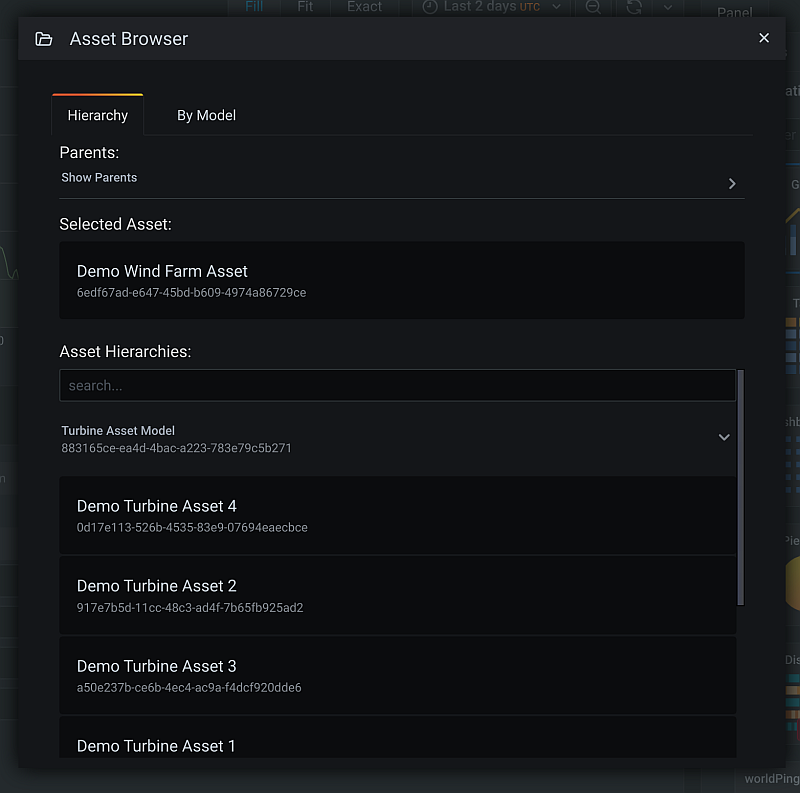
… or by hierarchy (for example, all the turbines on the wind farm):
For each asset, you can get property values, such as how much power it’s producing.
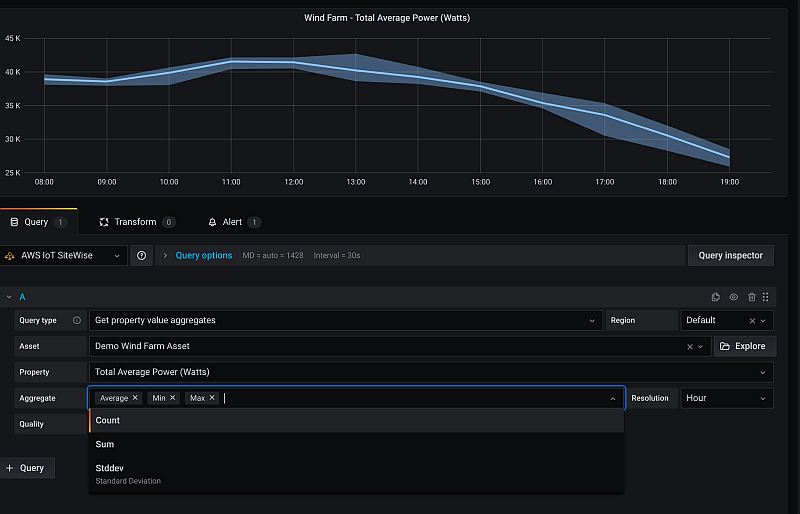
You can then find the property history – the values over time – as well as property aggregates, such as average power for a certain amount of time.
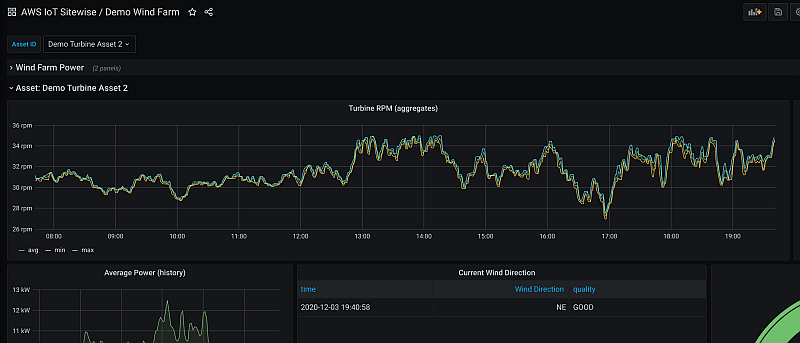
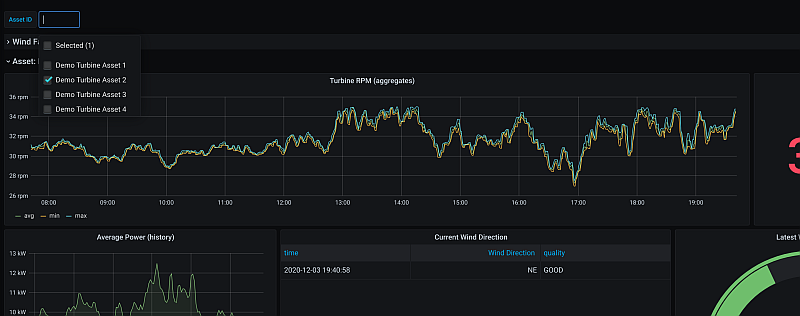
Using template variables, you can see a global view of the total wind farm power and also drill down to each turbine.
Alerting
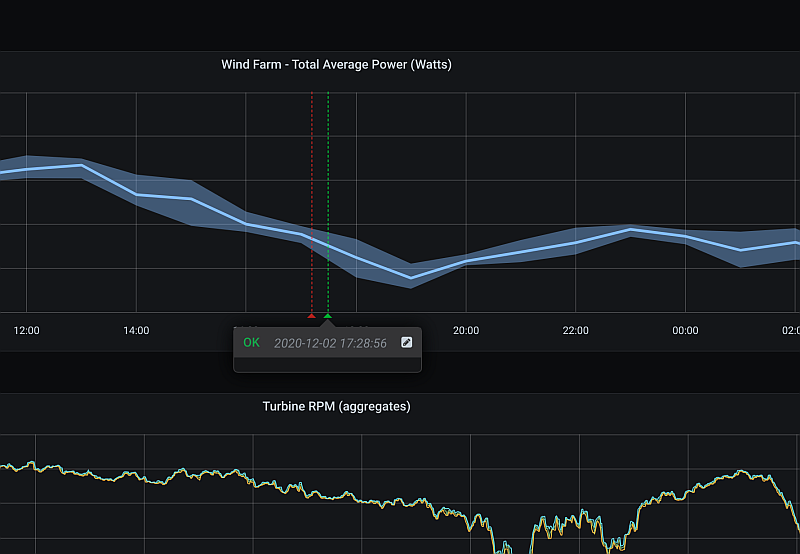
The plugin supports standard Grafana alerting.
Annotations
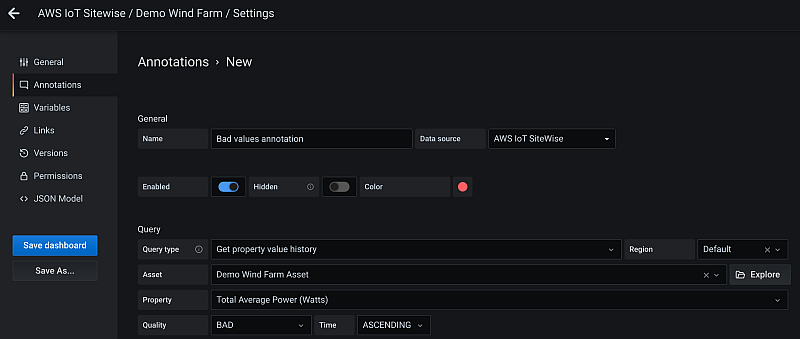
Annotations are also supported in the AWS IoT SiteWise plugin. For example, you can mark all “bad” data as annotations:
For more information
You can learn more about the AWS IoT SiteWise plugin for Grafana from the plugin download page and on the AWS blog. Check out the AWS IoT SiteWise website or the developer guide for more information about models, assets, hierarchies, and properties.

