
Kubernetes monitoring introduction
Kubernetes has transformed how modern operations teams deploy and scale applications. Although Kubernetes has made it much simpler to utilize containers in production, this doesn’t negate the need for a robust monitoring system that lets you interrogate the state of your systems.
Kubernetes monitoring is essential so you can track performance metrics, audit changes to deployed environments, and retrieve logs that help debug application crashes. Troubleshooting Kubernetes without a monitoring solution is tedious and error-prone, allowing problems to escalate as they often go unnoticed.
We’ll cover the basics of monitoring Kubernetes clusters and explain how to maximize the visibility of your workloads by identifying key opportunities to collect Kubernetes metrics. This will enable earlier error detection in your system’s lifecycle.
5 reasons to monitor Kubernetes
Production applications need to be monitored so you can detect errors, optimize resource usage, and manage costs. Kubernetes is no different: monitoring is often the difference between an effective cluster and one that’s underused and performs poorly.
![]()
1. Real-time alerts and early error detection
Proactively monitoring your Kubernetes clusters helps you detect errors early, before they affect your users. Log files, traces, and performance metrics provide visibility into what’s happening in your cluster, giving you advance warning of usage spikes and increasing error rates. Real-time alerts can inform you as soon as problems begin, avoiding awkward conversations that can result when users are the first to find an issue. This reduces service restoration time, which protects your brand’s reputation.
![]()
2. Better workload management and optimization
Comprehensive monitoring facilitates better workload management and more optimal use of your resources. Monitoring your Kubernetes cluster could reveal there’s too much resource contention, or uneven application pod distribution across your nodes. Simple scheduling adjustments such as setting affinities and anti-affinities can significantly enhance performance and reliability, but you’ll miss these opportunities without insights into real-world cluster usage.
![]()
3. Easier troubleshooting
Monitoring offers assistance when you’re troubleshooting problems. Accessing logs from your application and Kubernetes components is often the best way to discover reproduction steps and work towards discovering root causes. Without a monitoring solution, you’d have to hypothesize probable sources of issues, then use trial and error to test fixes. This increases the workload for developers, especially newcomers who are unfamiliar with the system. Being able to pinpoint problems earlier minimizes downtime and encourages everyone to contribute.
![]()
4. Real-time cost visibility
Kubernetes bill shock is real. Auto-scaling architectures let you adapt in real-time to changing demand, but this can also create rapidly spiraling costs. Monitoring is essential so you can view the number of nodes, load balancers, and persistent volumes that are currently deployed in your cloud account. Each of these objects will usually incur a separate cost from your provider.
![]()
5. Powerful insights
Kubernetes monitoring can yield unique insights that highlight opportunities to enhance your service. Beyond simple performance metrics, monitoring helps reveal how users interact with your application, which can inform future product decisions. Data from components such as ingress controllers will reveal the endpoints that are called the most, as well as the amount of data flowing through your infrastructure. This information provides a starting point when looking for features that need further expansion, either due to active engagement or low use because of poor discoverability.
Kubernetes monitoring: key components
A Kubernetes cluster comprises many different components that work together to support containerized workloads. You’ll encounter some of these during day-to-day administration, but others coordinate operations from behind the scenes.
The basic Kubernetes architecture is that applications run as containers within pods. Pods are distributed across multiple nodes, which represent the physical machines in your cluster. Nodes are coordinated by the control plane, which includes the API server for interacting with your cluster and several controllers. Controllers watch for changes in your cluster and take action to achieve the new desired state, such as starting containers when you add a pod object.
The complexity of a Kubernetes cluster means a multi-faceted approach to monitoring is always going to be required. Every item in the following diagram should be observed, so you can track the performance of your entire infrastructure:
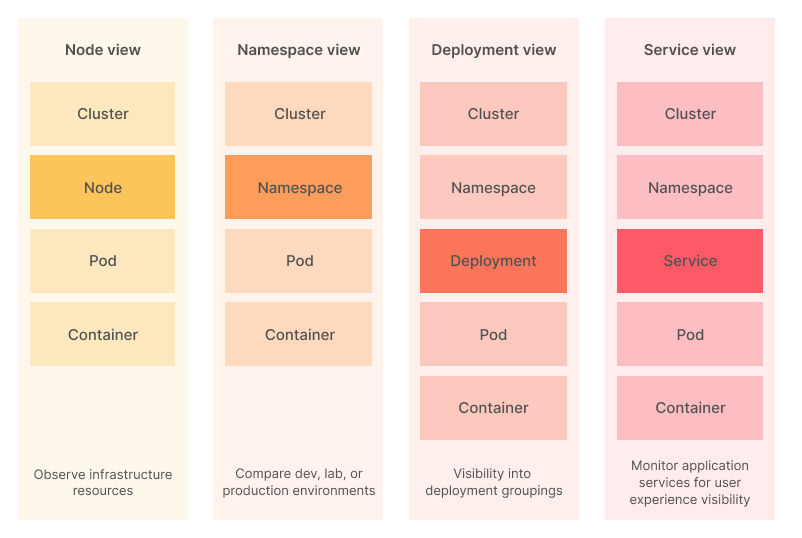
Next, we’ll review some of these components and how you can collect metrics from them.
Performance metrics
Performance monitoring lets you investigate cluster capacity issues and identify when it’s time to add more resources. The collected metrics will let you spot resource consumption trends, enabling you to stay ahead of slowdowns that are noticeable to users.
Node resource utilization metrics
Node resource utilization metrics, such as CPU and memory consumption, can be obtained using several mechanisms. The most common is to run an agent such as the Prometheus Node Exporter on each node. The metrics agent periodically scrapes the node’s current metrics and sends the data to your observability platform.
Alternatively, when you have the Metrics API installed in your cluster, Kubernetes can collect this data itself. Using the Metrics API allows you to access node metrics in your terminal using the kubectl top command. It provides convenient resource monitoring without any external dependencies.
Kubernetes clusters deployed from major cloud providers usually have their own monitoring dashboards, too. You may be able to log in to your cloud account to view basic graphs of key metrics without setting anything up yourself. This provides a convenient quick-start option, but won’t necessarily show you everything you need to know.
Regularly monitoring these fundamental hardware utilization metrics is essential so you can anticipate future usage and increase capacity ahead of demand. Routinely high CPU and memory consumption reduces your service’s performance headroom. This could lead to outages and instability if a usage spike occurs.
Object capacity and health metrics
The kube-state-metrics (KSM) service listens to Kubernetes API server events and exposes Prometheus metrics that document the state of your cluster’s objects. Over a thousand different metrics provide the status, capacity, and health of individual containers, pods, deployments, and other resources.
You can use this instrumentation to deeply interrogate the objects in your cluster. The Pod Metrics API, for example, provides over 40 individual data points about each pod, including the pod’s status, the time elapsed since its last state transition, the number of restarts that have occurred, and the resource limits that apply to it. Individual APIs are available for all the other Kubernetes built-in object types.
Monitoring these metrics can alert you to both cluster and application issues. Pods with high restart counts can suggest there’s resource contention in the cluster or a bug in your application that’s causing it to crash. Metrics exposed by KSM are provided raw, as collected by the Kubernetes control plane, allowing you to process and analyze them without preparation.
Storage health
Kube-state-metrics (KSM) can be used to monitor storage health, too. It includes APIs that expose metrics for storage classes, persistent volumes, and persistent volume claims, such as the capacity of volumes, whether they’re currently available, and the amount of space requested by each claim.
Another way to review storage health is with the Volume Health Monitoring system. This alpha feature is built into Kubernetes, and provides metrics describing the overall health of your persistent volumes. It includes a dedicated controller that watches for abnormal volume conditions that can indicate there’s a problem with your storage. The controller also sets events on your volumes when pods that access them are scheduled to failed nodes. This lets you check whether pods that have claimed a volume are actually operational.
Kubelet metrics
The Kubelet process that runs on your Kubernetes nodes provides detailed metrics that can be scraped using Prometheus. These are accessed via the /metrics endpoint on port 10255.
First discover your node’s IP address inside your cluster:
$ kubectl get nodes -o wide
NAME   	STATUS   ROLES              	AGE   VERSION   INTERNAL-IP	EXTERNAL-IP   OS-IMAGE         	KERNEL-VERSION  	CONTAINER-RUNTIME
minikube   Ready	control-plane,master   74d   v1.23.3   192.168.49.2   <none>    	Ubuntu 20.04.2 LTS   5.4.0-122-generic   docker://20.10.12
This node has the IP address 192.168.49.2. Now you can query its metrics data by accessing port 10255:
curl http://192.168.49.2:10255/metrics
# HELP apiserver_audit_event_total [ALPHA] Counter of audit events generated and sent to the audit backend.
# TYPE apiserver_audit_event_total counter
apiserver_audit_event_total 0
# HELP apiserver_audit_requests_rejected_total [ALPHA] Counter of apiserver requests rejected due to an error in audit logging backend.
# TYPE apiserver_audit_requests_rejected_total counter
apiserver_audit_requests_rejected_total 0
# HELP apiserver_client_certificate_expiration_seconds [ALPHA] Distribution of the remaining lifetime on the certificate used to authenticate a request.
# TYPE apiserver_client_certificate_expiration_seconds histogram
apiserver_client_certificate_expiration_seconds_bucket{le="0"} 0
apiserver_client_certificate_expiration_seconds_bucket{le="1800"} 0
apiserver_client_certificate_expiration_seconds_bucket{le="3600"} 0
...
The Kubelet metrics endpoint can be used to interrogate your node’s performance inside your cluster. The data exposes statistics that relate to Kubelet’s interactions with the Kubernetes control plane, such as the number of tasks in the work queue and the time taken to fulfill API requests.
Kubelet also provides cAdvisor metrics at the /metrics/cadvisor endpoint. cAdvisor (Container Advisor) is a tool that analyzes the resource usage and performance characteristics of your containers.
curl http://192.168.49.2:10255/metrics/cadvisor
# HELP cadvisor_version_info A metric with a constant '1' value labeled by kernel version, OS version, docker version, cadvisor version & cadvisor revision.
# TYPE cadvisor_version_info gauge
cadvisor_version_info{cadvisorRevision="",cadvisorVersion="",dockerVersion="",kernelVersion="5.4.0-122-generic",osVersion="Ubuntu 20.04.2 LTS"} 1
# HELP container_blkio_device_usage_total Blkio Device bytes usage
# TYPE container_blkio_device_usage_total counter
container_blkio_device_usage_total{container="",device="/dev/nvme0n1",id="/",image="",major="259",minor="0",name="",namespace="",operation="Async",pod=""} 0 1660656772812
container_blkio_device_usage_total{container="",device="/dev/nvme0n1",id="/",image="",major="259",minor="0",name="",namespace="",operation="Discard",pod=""} 0 1660656772812
container_blkio_device_usage_total{container="",device="/dev/nvme0n1",id="/",image="",major="259",minor="0",name="",namespace="",operation="Read",pod=""} 778240 1660656772812
...
These metrics facilitate analysis of CPU, memory, disk, and network utilization at the container level. Once you’ve identified a busy node using the cluster-level metrics discussed above, you can use the node’s cAdvisor output to find containers that are using too many resources and causing contention with other objects. High utilization could be down to an increase in user activity, suggesting you need to scale your service with more pods, or missing optimizations within the container that are causing elevated load.
Kubernetes logs
Beyond performance metrics and resource utilization, it’s important to capture and retain Kubernetes logs so you can refer to them in the future. Multiple Kubernetes components write events and errors directly to log files on the host file system. Here are some common paths to inspect.
On the Kubernetes control plane node, look at the following:
/var/log/kube-apiserver.log: This log contains events that occurred within the Kubernetes API server./var/log/kube-scheduler.log: A record of scheduling decisions, created when Kubernetes decides which node to place a pod to./var/log/kube-controller-manager.log: The log from the Kubernetes controller manager, which is responsible for running all the built-in controllers that watch for activity in your cluster.
On individual worker nodes, look at the following:
/var/log/kubelet.log: The kubelet process is responsible for maintaining communication between the nodes and the Kubernetes control plane server. This log file should be your starting point when you’re troubleshooting why a node has become unavailable./var/log/kube-proxy.log: This is where the logs from thekube-proxyprocess are stored. Thekube-proxyprocess is responsible for routing traffic through services to pods on the node.
You can access these log files by using a data collector such as Promtail or Grafana Agent to stream new lines straight to your monitoring platform. Installing one of these agents on your nodes will automate log collection. This lets you view logs alongside your performance metrics, and eliminates having to manually connect to a node to access its logs using Unix tools such as cat and tail.
Promtail also works with container-level logs written by your applications. Kubernetes creates container logs from data your process writes to its standard output and error streams. You should configure your applications to support this mechanism, since logs that are directly written to the container’s file system will be destroyed when it restarts. This can make it much harder to investigate bugs and crashes, as you’ll lose access to logged error messages and stack traces.
Using an agent to collect container logs and send them to a monitoring platform makes their contents more accessible. You’ll be able to search and filter log lines instead of relying on the simple chronological output that the kubectl logs command provides. Most log aggregation solutions, such as Grafana Loki, also support long-term log archiving, allowing you to revisit problems after containers have been restarted or replaced.
Traces
Tracing is a form of logging that records highly precise details about events that occur during a program’s execution. While the distinction between tracing and logging is sometimes vague, raw traces can be expected to be verbose, noisy, and designed to provide maximum fidelity to developers. Traces often consist of the sequence of code stack layers leading up to an event.
By contrast, log messages typically contain more human-centric information. They document that an event occurred without explaining what led up to it. A log message might be “failed to process payment.” The corresponding trace should show the step through the code, from the application’s entry point to trying to call an external payment provider and getting an error in response.
Individual operations within traces are referred to as spans. In the example above, the trace is the entire operation, from the user initiating the payment to the result being determined. Within the trace, there could be the following spans:
- Validate the user’s input, such as card details and voucher codes.
- Retrieve the contents of the user’s basket.
- Send the data to the backend payment provider.
- Store the result of the transaction.
- Send an order confirmation email.
Spans typically have their own metadata associated with them, such as their immediate parent, duration, and the operation that was performed. This distinction lets you drill down into specific parts of individual events, narrowing your search for problems.
The ability to review the code paths taken by requests can be invaluable when you’re debugging issues reported by users. Not every problem is easily reproducible in development; traces let you see exactly what happened during the user’s session, making issue resolution more efficient. Without a trace, you’d have to ask the user to confirm the exact steps they took before the bug occurred. This isn’t always possible, and won’t necessarily lead to a successful reproduction. Traces provide all the data you need, allowing you to move straight to remediation.
Kubernetes has built-in tracing, too. Several system components expose traces so you can better understand your cluster’s internal operations and measure performance. Integrated cluster-level tracing can be useful when you’re diagnosing a general problem that’s affecting all your applications, but user-deployed tracing at the application level is more effective when you’re precisely analyzing your code’s execution.
Kubernetes events
Kubernetes maintains a comprehensive history of all the events that occur in your cluster. You can view events in your terminal using kubectl:
$ kubectl get events
LAST SEEN 	TYPE  	REASON  	OBJECT       	MESSAGE
1m    		   Normal	Created 	pod/demo-pod 	Created container demo-pod
1m        	Normal	Started 	pod/demo-pod 	Started container demo-pod
Each event includes the name of the object it refers to, the action that occurred, the state of the object (such as “Normal” or “Failed”), and a message that briefly describes what happened. This provides a comprehensive history of activity in your cluster, including events generated by the Kubernetes control plane, as well as those produced in response to user actions.
You can get the events associated with a specific object by filtering with the --field-selector flag. This example retrieves the events for the demo-pod pod by matching the involvedObject.kind and involvedObject.name fields on event objects:
$ kubectl get events \
    --field-selector involvedObject.kind=Pod \
    --field-selector involvedObject.name=demo-pod
LAST SEEN 	TYPE  	REASON  	OBJECT       	MESSAGE
1m    		   Normal	Created 	pod/demo-pod 	Created container demo-pod
1m        	Normal	Started 	pod/demo-pod 	Started container demo-pod
You can modify this example to support any other object by substituting the involvedObject.kind field with the name of the object type you’re looking for, such as Deployment, ReplicaSet, or Job.
Events can be invaluable in understanding the sequence of actions that led up to a particular problem. Virtually every action connected to an object will show in the list, from successfully creating a container to failed jobs, image pull errors, and low memory conditions.
Kubernetes treats events as transient records that are cleaned up automatically soon after they occur. In most cases, events are deleted after only an hour. You should use an agent-based data collector to stream events to an observability solution such as Grafana. This will let you retrieve, search, and archive events long after they’ve occurred, providing another reference point when troubleshooting future issues.
Containerized application metrics
It’s important to monitor your containerized workloads alongside your cluster’s health. Creating your own in-app metrics API that exports Prometheus-compatible data will let you scrape performance statistics using your observability solution.
Prometheus has official client-side libraries for Go, Java/Scala, Python, Ruby, and Rust. Community-supported options are available for most other popular languages too. These libraries let you define and expose custom application metrics using an HTTP endpoint on your application instance.
As an example, you might want to track how long it takes to perform specific business functions, such as handling a login or completing a payment transaction. Prometheus simplifies measuring these durations and exposing them as metrics you can scrape, minimizing the amount of code you need to write.
Taking the time to instrument your workloads strengthens observability by letting you analyze performance at the application level. It’s ultimately the time required to process application functions that matters most to users, not absolute CPU consumption or cluster utilization. Tracking trends in business-specific measurements uncovers opportunities to improve the user experience and lets you spot emerging performance issues before they become a node-level or cluster-level problem.
Conclusion
Kubernetes has more moving parts than traditional deployment solutions, and requires a fresh approach to monitoring and observability. Beyond basic logging, application health, and resource utilization metrics, you also need to assess the performance of the individual components within the Kubernetes control plane.
In this article, we’ve looked at the components that must be considered when creating a comprehensive Kubernetes monitoring solution. Focusing on the areas listed above will provide insights that surface the internal operation of your cluster and its workloads. You’ll be able to identify emerging problems early, as well as new opportunities to improve and enhance your cluster usage.
Get started with Kubernetes Monitoring in Grafana Cloud
Whether you’re an application developer rolling out new changes, an SRE seeking a better way to troubleshoot infrastructure incidents, or a DevOps administrator maintaining the bare-metal servers that run the clusters, Grafana Labs is here to help. Enter Kubernetes Monitoring, the full solution for all levels of Kubernetes usage with out-of-the-box access to your Kubernetes infrastructure’s metrics, logs, and Kubernetes events as well as prebuilt dashboards and alerts. Kubernetes Monitoring is available to all Grafana Cloud users, including those on the generous free forever tier.