Important: This documentation is about an older version. It's relevant only to the release noted, many of the features and functions have been updated or replaced. Please view the current version.
Results output
As k6 generates load for your test, it also makes metrics that measure the performance of the system. Broadly, you can analyze metrics in two ways:
- As summary statistics, in an end-of-test summary report.
- In granular detail, with measurements for every data point across test (and timestamps)
You can customize almost every aspect of result output:
- Create custom metrics
- Configure new summary statistics and print them to any text format.
- Stream the results to one or multiple services of your choice (for example, InfluxDB or Prometheus).
Metrics
Documentation: Using metrics
k6 comes with built-in metrics about the test load and the system response. Key metrics include:
http_req_duration, the end-to-end time of all requests (that is, the total latency)http_req_failed, the total number of failed requestsiterations, the total number of iterations
End-of-test summary
Documentation: End-of-test summary
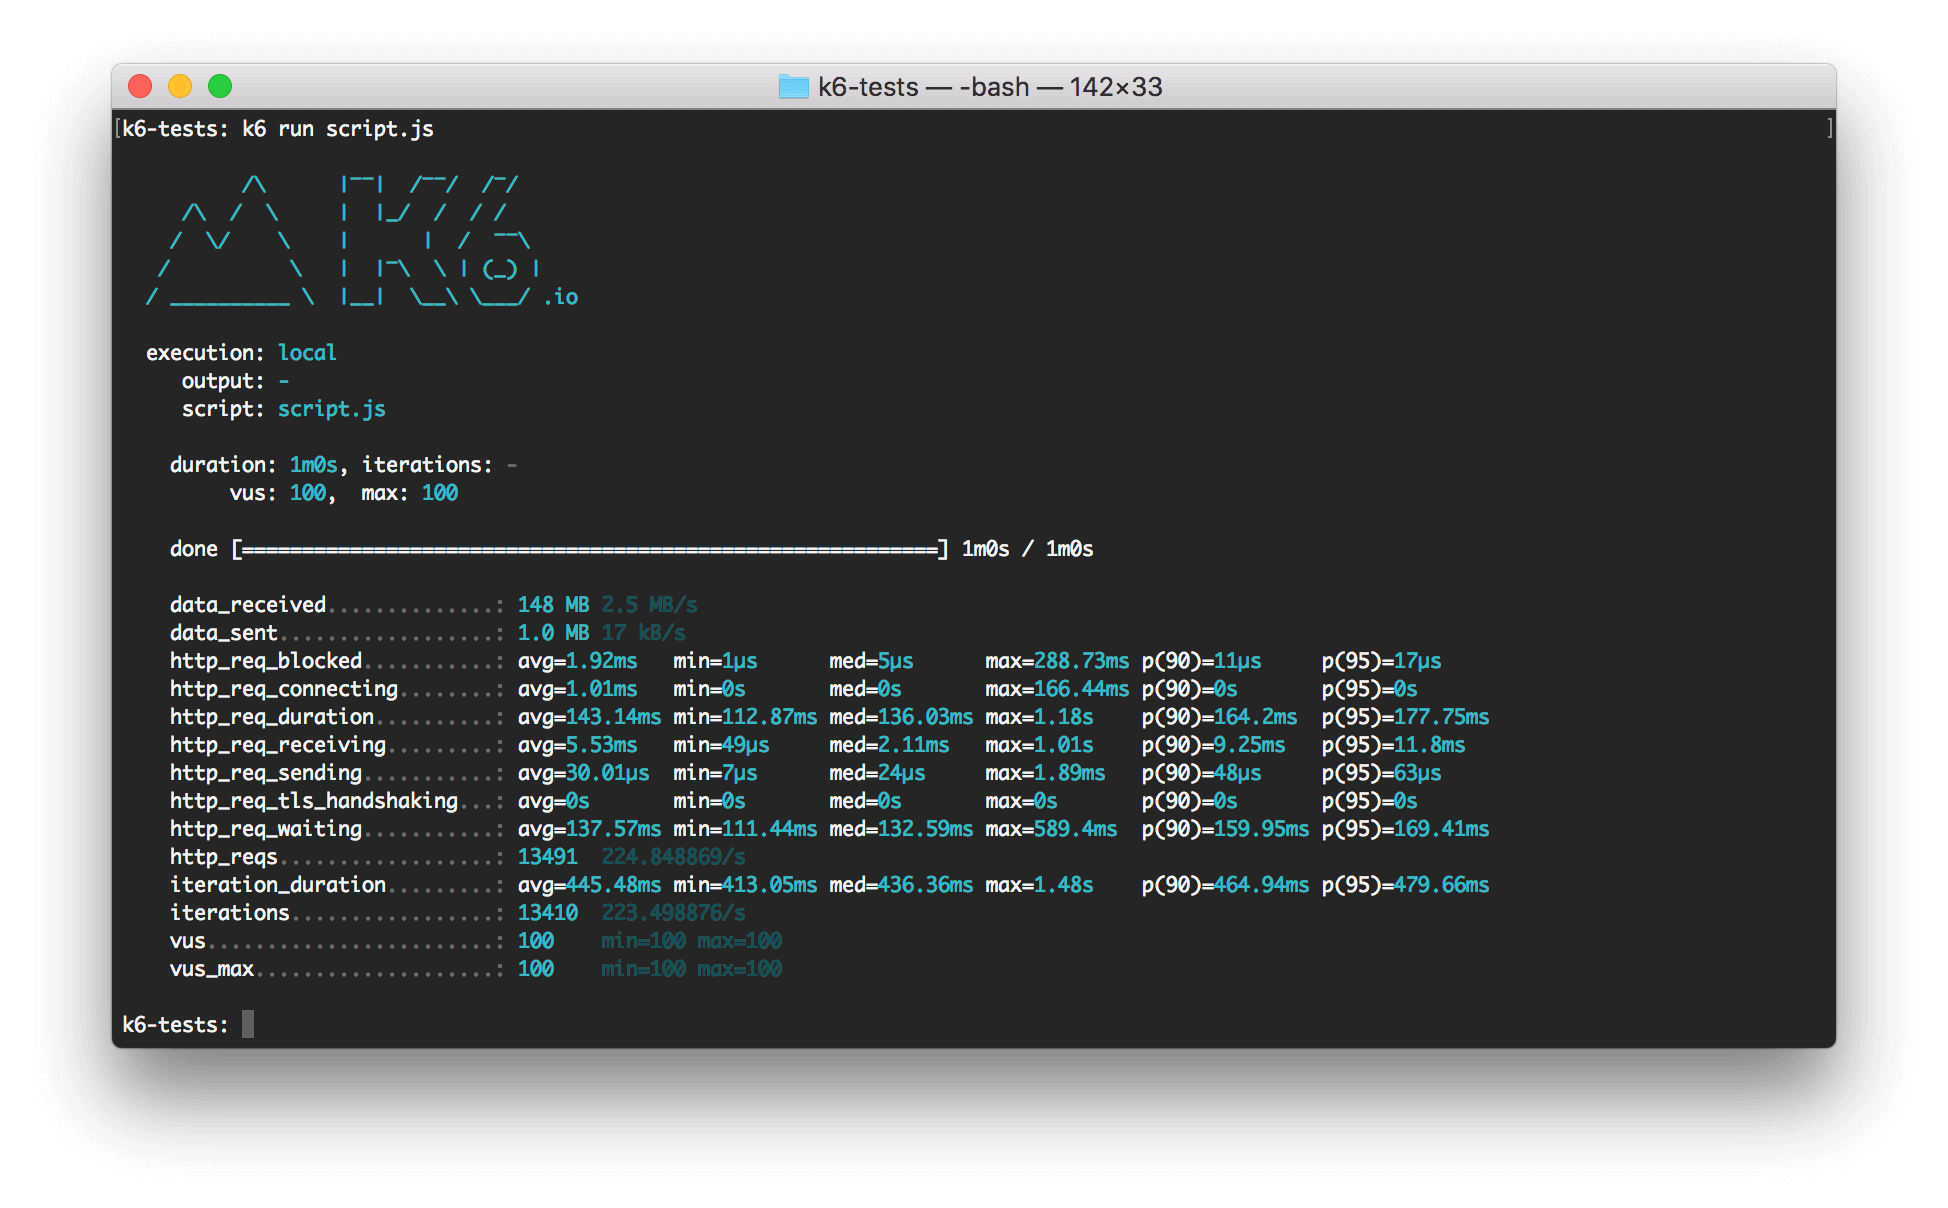
By default, k6 prints summarized results to stdout.
When you run a test, k6 outputs a plain-text logo, your test progress, and some test details. After the test finishes, k6 prints the full details and summary statistics of the test metrics.

The end-of-test summary shows aggregated statistical values for your result metrics, including:
- Median and average values
- Minimum and maximum values
- p90, p95, and p99 values
You can configure the statistics to report with the
--summary-trend-stats option.
For example, this command displays only median, p95, and p99.9 values.
k6 run --iterations=100 --vus=10 \
--summary-trend-stats="med,p(95),p(99.9)" script.js
Custom reports with handleSummary()
For completely customized end-of-summary reports, k6 provides the handleSummary() function.
At the end of the test, k6 automatically creates an object with all aggregated statistics.
The handleSummary() function can process this object into a custom report in any text format: JSON, HTML, XML, and whatever else.
Time series and external outputs
Documentation: Real-time metrics
The condensed end-of-test summary provides a top-level view of the test. For deeper analysis, you need to look at granular time-series data, which has metrics and timestamps for every point of the test.
You can access time-series metrics in two ways:
- Write them to a JSON or CSV file.
- Stream them to an external service.
In both cases, you can use the --out flag and declare your export format as the flag argument.
If you want to send the metrics to multiple sources, you can use multiple flags with multiple arguments:
k6 run \
--out json=test.json \
--out influxdb=http://localhost:8086/k6
The available built-in outputs include:

