
Important: This documentation is about an older version. It's relevant only to the release noted, many of the features and functions have been updated or replaced. Please view the current version.
Phlare data source
Grafana ships with built-in support for Phlare, a horizontally scalable, highly-available, multi-tenant, OSS, continuous profiling aggregation system from Grafana Labs. Add it as a data source, and you are ready to query your profiles in Explore.
Configure the Phlare data source
To configure basic settings for the data source, complete the following steps:
Click Connections in the left-side menu.
Under Your connections, click Data sources.
Enter
Phlarein the search bar.Click Phlare.
The Settings tab of the data source is displayed.
Set the data source’s basic configuration options:
Querying
Query Editor
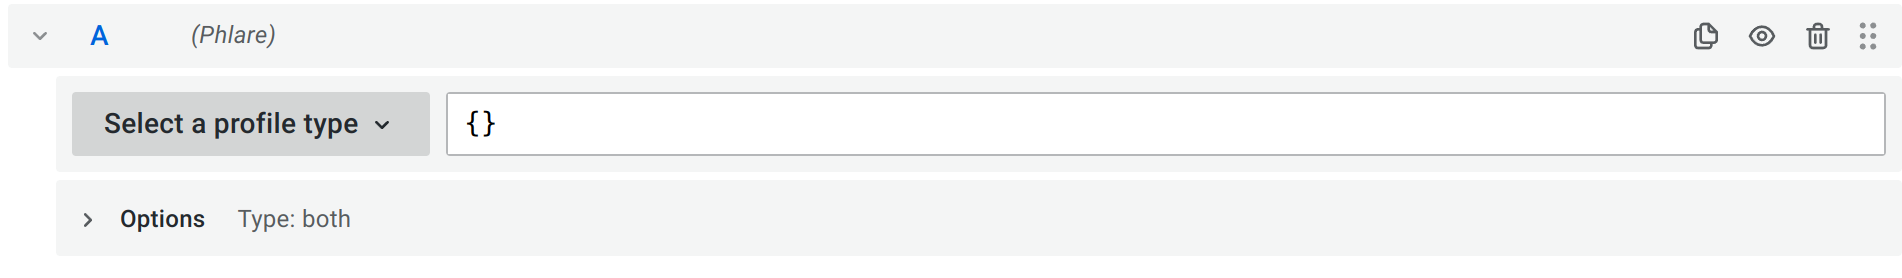
Query editor gives you access to a profile type selector, a label selector, and collapsible options.
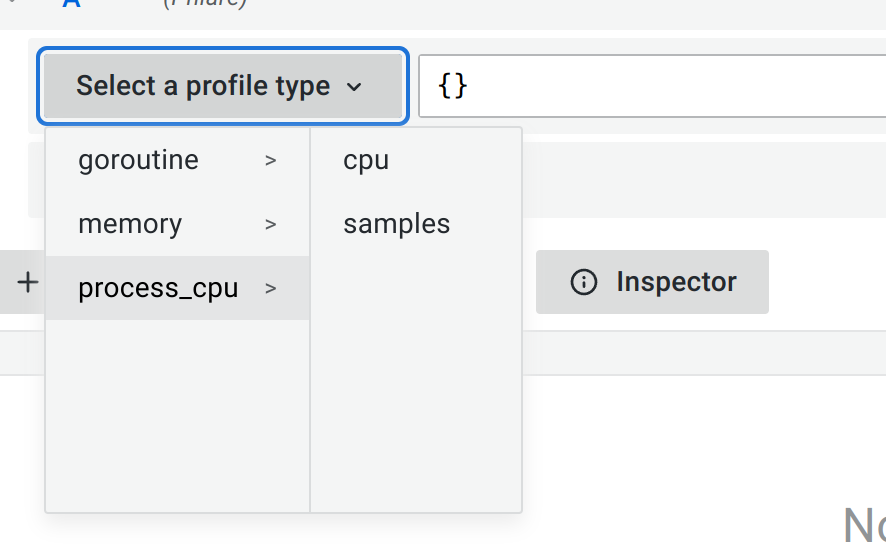
Select a profile type from the drop-down menu. While the label selector can be left empty to query all profiles without filtering by labels, the profile type must be selected for the query to be valid. Grafana does not show any data if the profile type isn’t selected when a query is run.
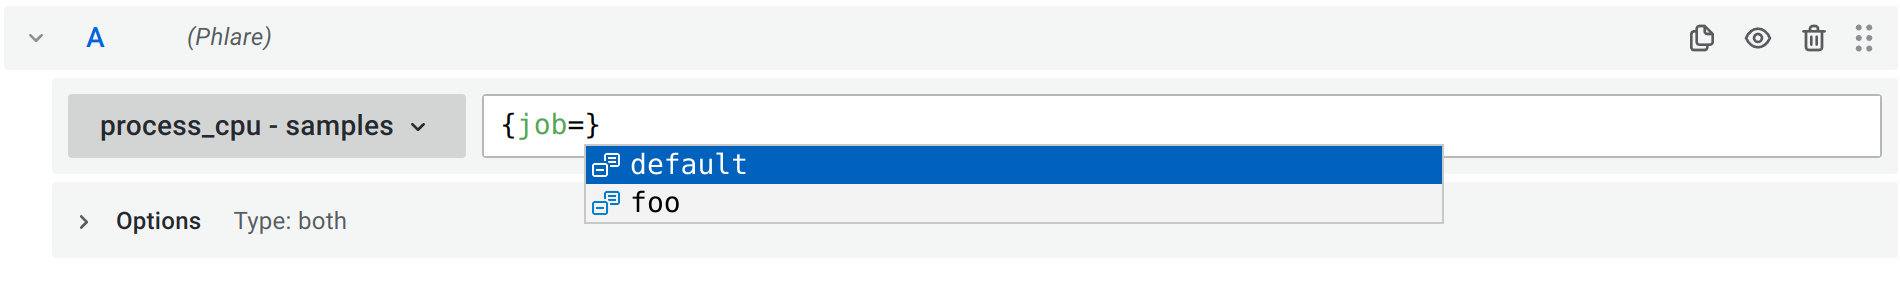
Use the labels selector input to filter by labels. Phlare uses similar syntax to Prometheus to filter labels. Refer to Phlare documentation for available operators and syntax.
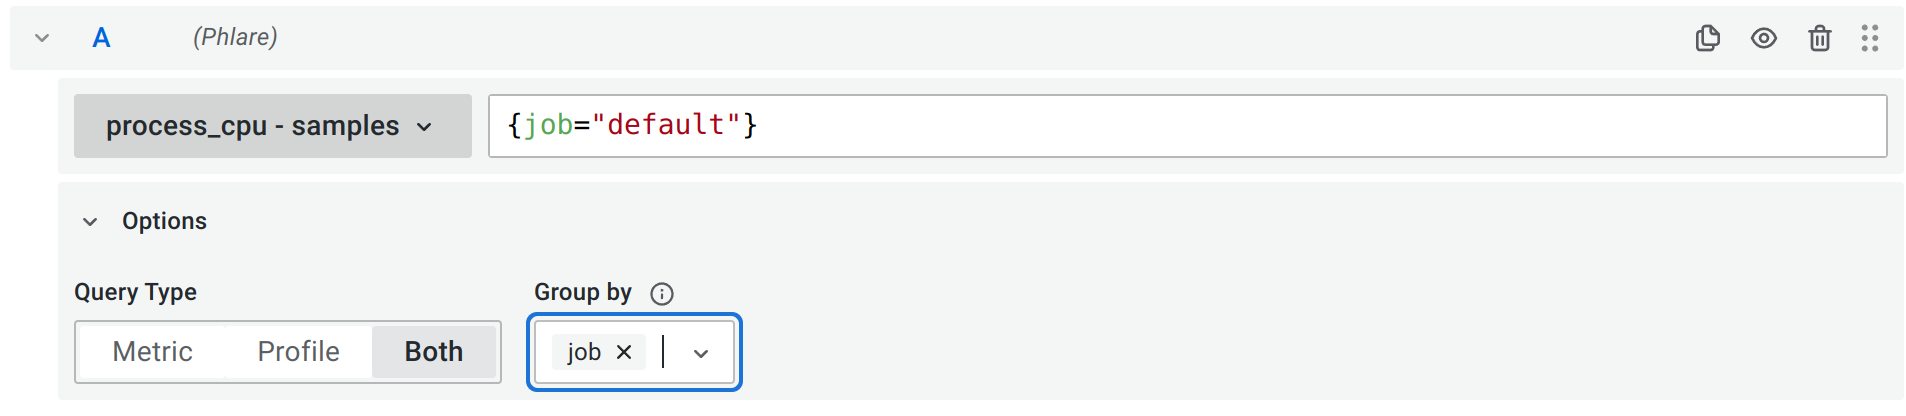
Options section contains a switch for Query Type and Group by.
Select a query type to return the profile data which can be shown in the Flame Graph, metric data visualized in a graph, or both. You can only select both options in a dashboard, because panels allow only one visualization.
Group by allows you to group metric data by a specified label. Without any Group by label, metric data is aggregated over all the labels into single time series. You can use multiple labels to group by. Group by has only an effect on the metric data and does not change the profile data results.
Profiles query results
Profiles can be visualized in a flame graph. See the Flame Graph documentation to learn about the visualization and its features.
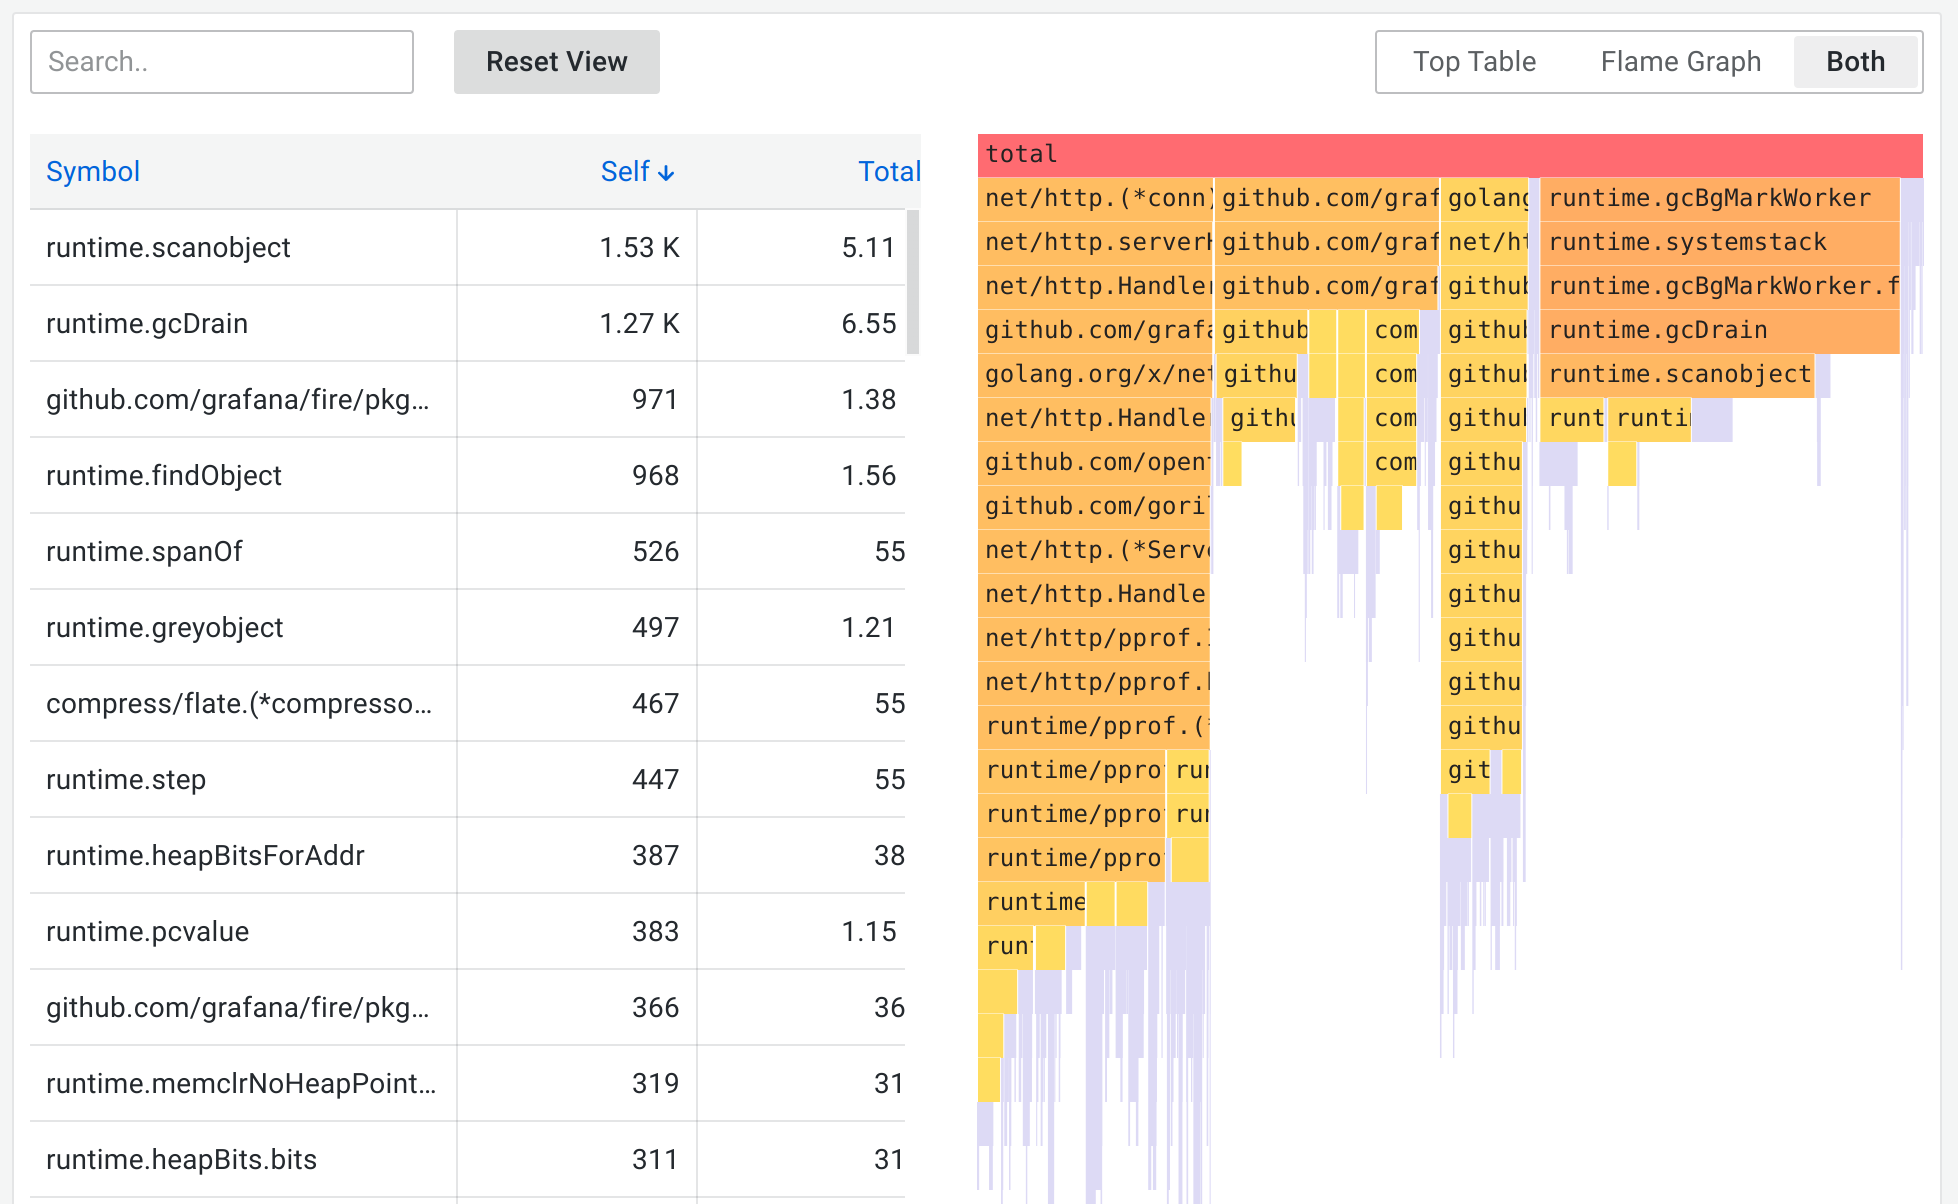
Phlare returns profiles aggregated over a selected time range, and the absolute values in the flame graph grow as the time range gets bigger while keeping the relative values meaningful. You can zoom in on the time range to get a higher granularity profile up to the point of a single Phlare scrape interval.
Metrics query results
Metrics results represent the aggregated sum value over time of the selected profile type.
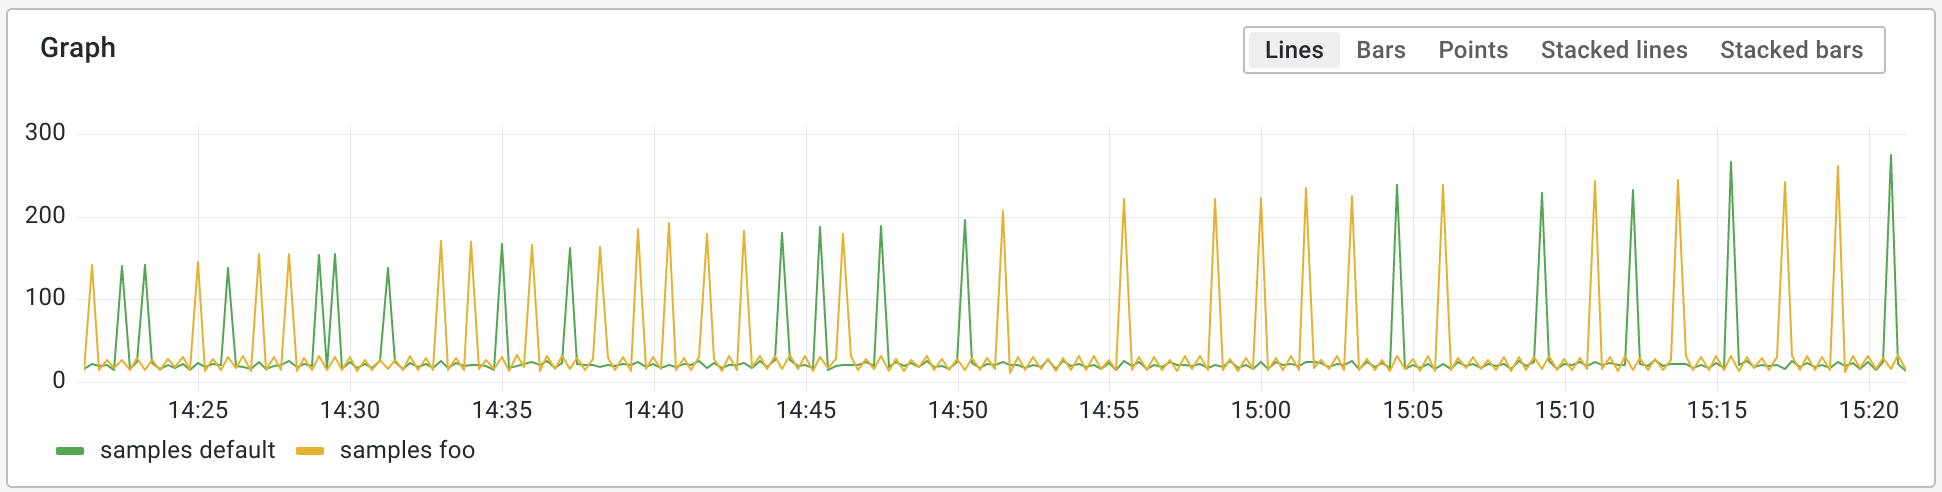
This allows you to quickly see any spikes in the value of the scraped profiles and zoom in to a particular time range.
Provision the Phlare data source
You can modify the Grafana configuration files to provision the Phlare data source. To learn more, and to view the available provisioning settings, see provisioning documentation.
Here is an example config:
apiVersion: 1

datasources:
  - name: Phlare
    type: phlare
    url: http://localhost:4100
    jsonData:
      minStep: '15s'
Was this page helpful?
Related resources from Grafana Labs


