2026 observability trends and predictions from Grafana Labs: unified, intelligent, and openFind out which trends will shape observability in 2026, based on insights from 150 IT decision-makers and the engineers building Grafana Cloud.AIAdaptive TelemetryOpenTelemetrySLOs
Grafana 12.3 release: Interactive learning experiences, new and improved logs visualizations, and moreReleaseGrafana
2026 observability trends and predictions from Grafana Labs: unified, intelligent, and openAIAdaptive TelemetryOpenTelemetrySLOs
Lunar-level observability: How Firefly Aerospace used Grafana to monitor its historic moon landingCommunityGrafanaConGrafana
Database observability: How OpenTelemetry semantic conventions improve consistency across signalsOpenTelemetry
How to send alerts from Grafana OSS to Grafana Cloud IRMGrafana Cloud IRMGrafanaGrafana EnterpriseGrafana CloudAlerting
Optimizing the end-user experience: How to perform a browser check in Grafana Cloud Synthetic MonitoringSynthetic monitoring
Simple cloud cost management: Grafana Labs integrates open standard FOCUS specification for cloud billing dataCost management
What’s new in Grafana Metrics Drilldown: advanced filtering options, UI enhancements, and moreDrilldown
Kubernetes observability: How to enrich logs with GeoIP using the Kubernetes Monitoring Helm ChartKubernetes MonitoringGrafana Cloud
How to import Prometheus-style alerts and recording rules to Grafana-managed alerts and recording rulesAlertingPrometheusGrafana
Grafana security release: Medium and high severity security fixes for CVE-2025-4123 and CVE-2025-3580Security
Grafana Cloud updates: New observability as code tools, Grafana Drilldown enhancements, and moreGrafana Cloud
Customize your incident response with new features in Grafana Cloud IRMGrafana Cloud IRMIncident Response & Management
OpenTelemetry with Prometheus: better integration through resource attribute promotionPrometheusOpenTelemetryMimir
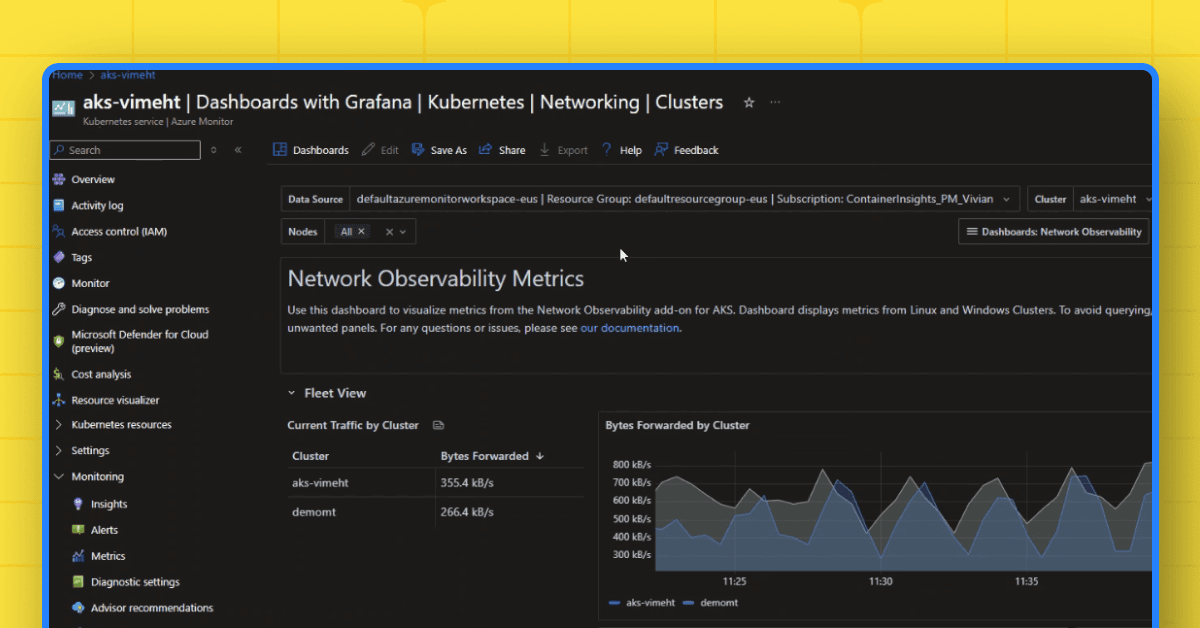
Azure Monitor offers Grafana dashboards natively for immediate real time operational monitoringDashboard
Dashboards and detergent: How two students monitor laundry machines in a college dorm with GrafanaGrafanaVisualizationCommunity
Grafana security update: post-incident review for GitHub workflow vulnerability and what’s nextSecurity
Introducing SCIM provisioning in Grafana: Enterprise-grade user management made simpleGrafanaGrafana EnterpriseGrafana CloudSecurity