Using Grafana to measure the health of your NGINX instances with NGINX Instance Manager
Update: The content in this blog post refers to an older version of NGINX Instance Manager. Newer versions, NGINX Instance Manager 2.0 and forward, have alternate ways for connecting to Grafana. To learn about how to monitor the health of your NGINX instances in Grafana Cloud, check out our blog post.
Daniel Edgar is a Senior Technical Product Manager in the NGINX business unit at F5, focused on the delivery of application security products. He brings 20+ years of application development experience into the role to help customers deliver their applications in a secure and operationally sustainable manner.
Grafana is an extremely powerful application and infrastructure observability and health platform. The ability to quickly generate operational insights from an amalgamation of sources is compelling. Grafana also benefits from the ability to natively query a Prometheus endpoint to display time-based metrics for display in a dashboard.
We’ve built the NGINX Instance Manager tool to measure the health of your NGINX instances with the help of Grafana. We just released a new version, and we’re excited to share with you how to get the most out of it.

What is NGINX Instance Manager?
NGINX Instance Manager is a tool for managing NGINX data plane instances. NGINX Instance Manager provides an API, configuration management, and metrics for both NGINX Open Source and Plus instances. It works with existing tools and processes you already have. NGINX Instance Manager quickly discovers all NGINX Open Source and NGINX Plus instances across your infrastructure. It highlights instances running software versions with potential exposure to CVEs, so you can upgrade them to a version with fixes.
Additionally, NGINX Instance Manager collects metrics such as CPU, memory, and HTTP status code occurrence from the NGINX instances it manages. These metrics are validated then marshalled into a Prometheus-compliant data store. Since NGINX Instance Manager is already doing the heavy lifting for us, all we need to do is query these metrics and display them in a Grafana dashboard. Fortunately, NGINX provides this dashboard for free, so you don’t have to build it yourself. So how do we set it up?
Getting started
First up, you’ll need to collect various configuration items, so Grafana knows where to collect the Prometheus data. You’ll need the hostname of the NGINX Instance Manager server and the HTTPS port of the NGINX Instance Manager server (this will typically be 443).
- In Grafana, click Configuration -> Data Sources in the side menu then click the Add data source button:

- Select the Prometheus type:

- Provide values for the Name and URL fields. Since the dashboard you will import in a later step is expecting a data source name of
nginx-manager, this is the value you will need to put in the Name field. For URL, specify the complete URL (including your specific hostname and port). For example, in the screenshot below, I am using a URL of https://lightning.f5demolab.com:443/metrics/. Click the Save & Test button:

- If the connection test was successful, you will receive a confirmation at the bottom:

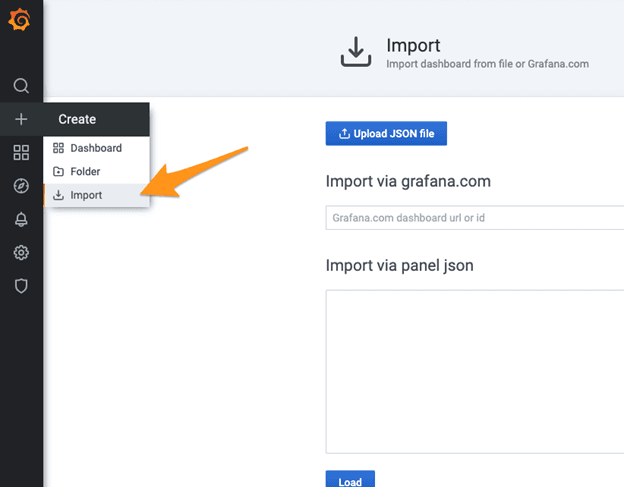
- Click Create -> Import in the Grafana side menu:

- Enter the ID
14530into the Import via Grafana.com field and click Load:

- Select
nginx-managerfrom the Prometheus dropdown menu and click the Import button. The dashboard will be imported and displayed.

Using the dashboard
Once the dashboard has loaded, you will see dials and graphs representing the metrics associated with your NGINX instance(s). At this time, I encourage you to explore the contents of the dashboard.
If more than one instance is being managed by NGINX Instance Manager, you can switch between the instances by using the hostname dropdown menu in the top left corner of the dashboard:

Next steps
Although not covered here, you may wish to set up alerts based upon thresholds of metrics that are displayed in the dashboard. For instance, I can set up an alert in Grafana to send my team a Slack message when the CPU utilization percentage exceeds 80% for a given period of time. For guidance on setting up alerts, see the documentation here.
While the focus of this article was based on setting up the data source and dashboard via Grafana’s graphical user interface, you can always use the REST API to automate the deployment of them to your Grafana server. More information on the Grafana HTTP API can be found here.
Conclusion
Gleaning operational insights relating to your NGINX instances isn’t difficult, thanks to tools such as Prometheus and Grafana. The Grafana dashboard provided by NGINX Instance Manager is merely a starting point. I encourage you to customize the dashboard to meet the specific operational needs of your company. What will you do with it next?


