Robot Framework Grafana Dashboard - PostgreSQL
Robot Framework Test Results Grafana Dashboard in PostgreSQL

Robot Framework Test Results are parsed and stored in PostgreSQL DB. Please go through the following link to see how to parse the test results to PostgreSQL DB - CQE - Robot Framework Grafana Dashboard
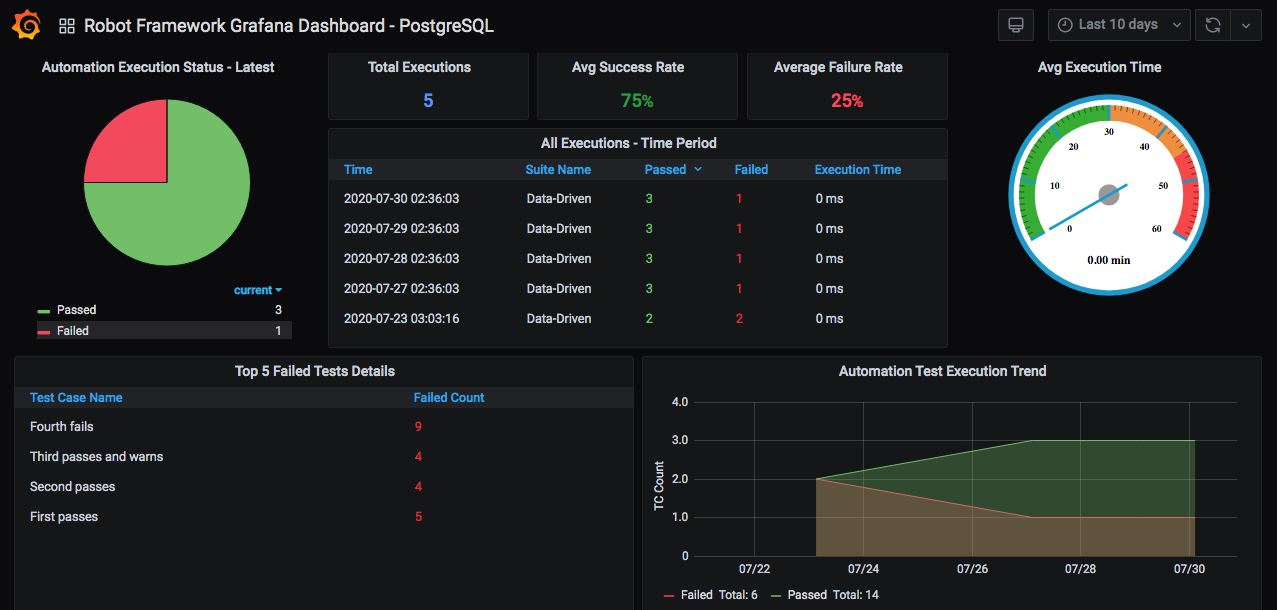
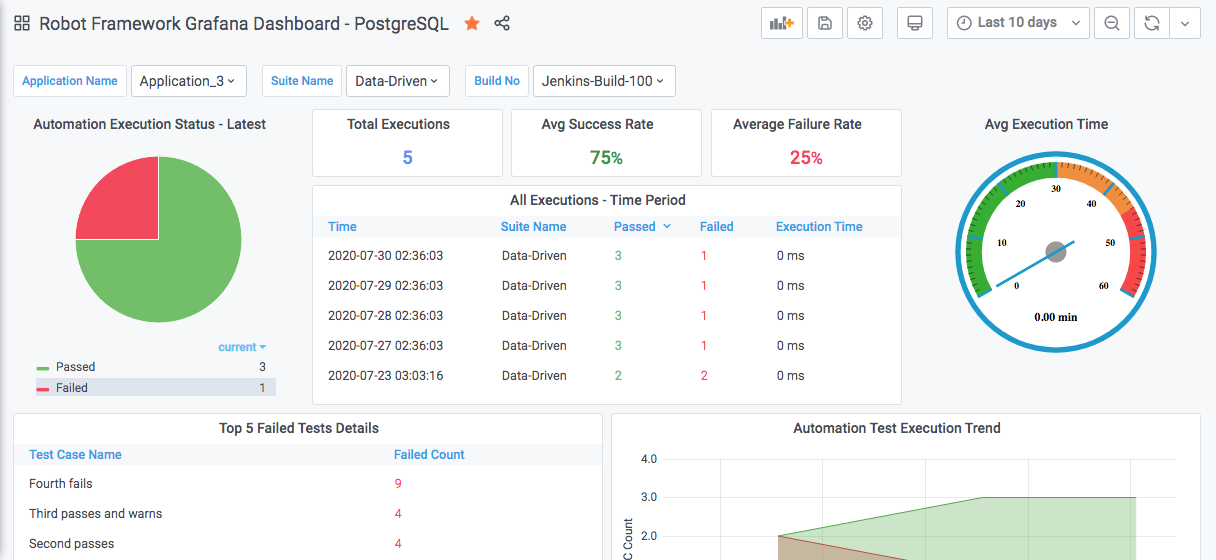
Metrics Covered By Robot Framework Grafana Dashboard :
- Execution Status - Latest
- Total Executions - Over Time Period
- Average Pass and Failure Percentage
- Top 5 Failed Test Cases
- All Execution Status Over Time Period
- Average Execution Time
- Execution Trend Graph

Data source config
Collector type:
Collector plugins:
Collector config:
Revisions
Upload an updated version of an exported dashboard.json file from Grafana
| Revision | Description | Created | |
|---|---|---|---|
| Download |
PostgreSQL
Easily monitor your deployment of PostgreSQL, the open source relational database, with Grafana Cloud's out-of-the-box monitoring solution.
Learn more