Instrumentation Hub: a guided, scalable way to roll out observability coverage without losing controlGrafana AlloyGrafana CloudKubernetes MonitoringApplication observabilityeBPFOpenTelemetry
What's new in the Grafana Image Renderer: higher-quality results, security enhancements, and moreGrafanaGrafana CloudDashboard
Grafana Labs: Top 10 moments of 2025From the launch of Grafana Assistant to the first-ever GrafanaCON Science Fair, there were a lot of big moments for Grafana Labs and our open source community in 2025. Here are some of the highlights.Company news
Grafana 12.3 release: Interactive learning experiences, new and improved logs visualizations, and moreReleaseGrafana
Instrumentation Hub: a guided, scalable way to roll out observability coverage without losing controlGrafana AlloyGrafana CloudKubernetes MonitoringApplication observabilityeBPFOpenTelemetry
A privacy-first, data-driven approach to optimize the user experience: Introducing Geolocation Insights in Frontend ObservabilityFrontend observability
How to prevent performance bottlenecks in Google Compute Engine: CPU spikes, RAM waste, and network overloadCloud Provider Observability
Grafana 11.6 release: new data visualization features, LBAC for metrics data sources, alerting updates, and moreGrafana
The state of observability in 2025: a deep dive on our third annual Observability SurveyObservability
GrafanaCON 2025: Agenda highlights and how to start planning your conference experience todayGrafanaConEventsCommunity
An open source app for easily building performance tests: Grafana k6 Studio is generally availablek6Grafana Cloud k6Performance Testing
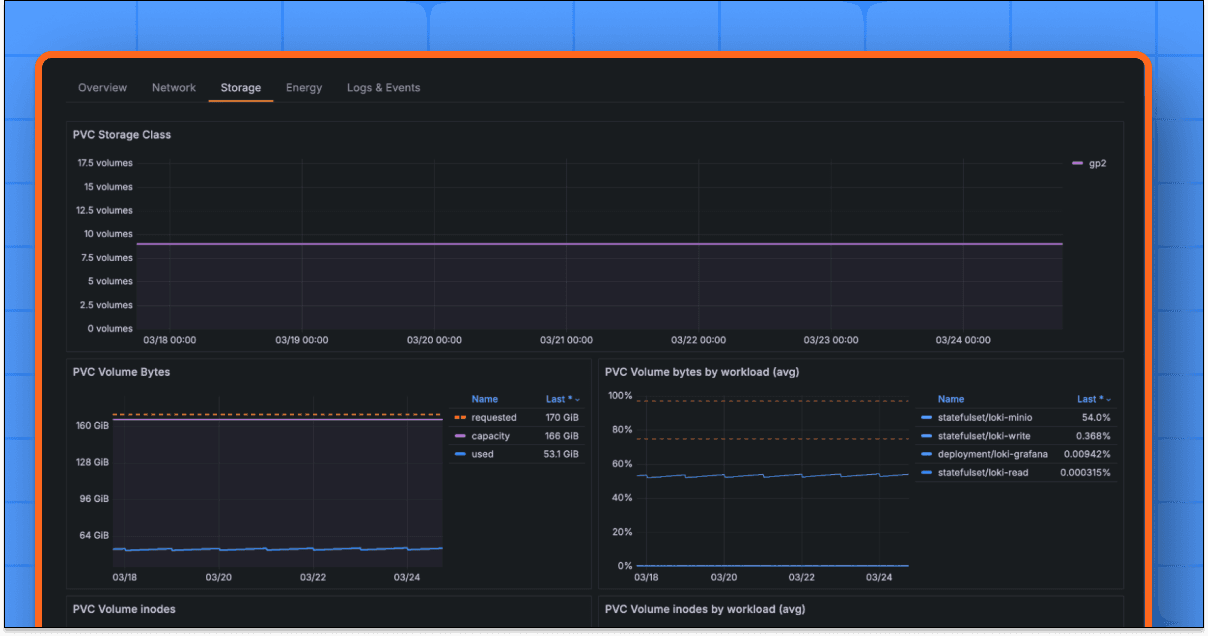
The latest in Kubernetes Monitoring: new features to track persistent storage, simplify alerting, and moreKubernetes MonitoringGrafana Cloud
The Golden Grot Awards need you: Vote for your favorite dashboard today!Golden GrotsCommunityGrafanaConGrafana