
How Grafana Labs Optimizes Performance with webpack
Performance is one of those things that most people will agree is super important, but nevertheless tends to get overlooked. In light of that, I wanted to share the approach we recently took with auditing the Grafana product’s performance, and how we went about trying to improve it.
The Audit
There’s a quote that gets paraphrased a lot when talking about optimization: “If you can’t measure it, you can’t manage it.” There’s definitely truth to that, so before even thinking of making any changes, I needed to audit Grafana in order to have an idea of 1) where we’re at in terms of performance, and 2) what areas we should investigate further.
Fortunately Google’s Lighthouse suite allows you to audit your site right from Chrome’s dev tools. It’s incredibly easy to use and provides some really useful metrics for evaluating a page’s performance – things like first contentful paint, first meaningful paint, time to interactivity, and more. These metrics give us something concrete to improve upon. Plus, Lighthouse even gives advice on steps that can be taken to improve performance.
Based on the results of the audit, it was clear that the largest bottleneck was the size of the resources being downloaded. With JavaScript in particular, it makes sense that the larger the JS file, the longer it takes to parse and compile.
The Solution
It seemed like making some adjustments to the configuration of Grafana’s open-source JavaScript module bundler webpack could be a good approach to improving performance. To help with this, I used a really handy tool called webpack bundle analyzer that lets you investigate the produced bundles with an interactive treemap.
Here’s the output from before any optimization was done:

We can tell from the output that three bundles are produced: 1. “vendor” bundle that contains all of Grafana’s external dependencies 2. A main bundle that contains (almost) all of Grafana’s internal code 3. A bundle that contains some Explore-related code that was produced using Webpack’s dynamic import feature
The problem with having all of our external dependencies in one big file is that, at any given moment, most of the resources are going unused.
Translation: We’re downloading a lot of data for no real reason.
Chrome devtools has a handy “coverage” feature that lets us find out exactly how much is going unused.

We can see at the bottom that 4MB, or two-thirds of the downloaded resources, are not being utilized.
There are several ways we can improve on this. One way is with dynamic imports, a webpack feature that allows us to split some resources out from a bundle and have them “lazy loaded” right before they’re actually needed.
We already do this for Explore. Ideally lazy loading would be used for every package, but a good starting point is using the technique on large packages that are infrequently used.
Two candidates that fit this description for Grafana Labs are brace, and rst2html. Using dynamic imports, webpack will produce a bundle for each of these packages, respectively, but they’ll only be downloaded when the application really needs them. This is great because it means we’re no longer downloading resources we don’t use, and we’re saving space and bandwidth in the process.
Another great use case for dynamic imports is route-based code splitting. Rather than loading the resources for both Explore and dashboards all at once, we can use route-based code splitting to only download the resources that are related to what we’re working on within Grafana.
We can also use this approach with Grafana’s built-in data sources so that only the data source plugin code related to the data source we’re currently working with is loaded.
Here’s what our coverage looks like after these changes:

Here’s what the produced bundles looked like after optimization: [[SC_TOKEN_]3]]
The Results & What’s Next
There’s definitely still some room for improvement, but it’s not a bad starting point!
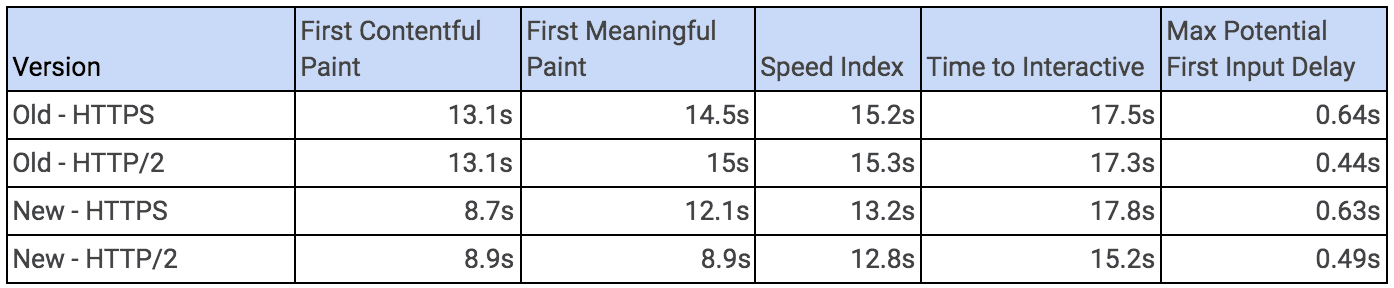
We can see that several key performance metrics such as First Contentful Paint, First Meaningful Paint, and Speed Index experience significant improvements after our changes. Making use of HTTP/2 sees an even greater uptick in these performance metrics.
Here is a look at our Dashboard Performance:

Here’s a look at our Explore Performance:


Some other small changes were made following the advice of this useful Github repo, which explains how to optimize common dependencies, such as moment, lodash, and react.
To follow these improvements, a nice next step would be to pare down the size of the HTML, especially with some of our more frequently used React components since fewer DOM nodes means fewer things to render. In addition, tidying up our CSS to eliminate redundancies and unused styles could also yield some performance gains.

