Instrumentation Hub: a guided, scalable way to roll out observability coverage without losing controlGrafana AlloyGrafana CloudKubernetes MonitoringApplication observabilityeBPFOpenTelemetry
What's new in the Grafana Image Renderer: higher-quality results, security enhancements, and moreGrafanaGrafana CloudDashboard
Grafana Labs: Top 10 moments of 2025From the launch of Grafana Assistant to the first-ever GrafanaCON Science Fair, there were a lot of big moments for Grafana Labs and our open source community in 2025. Here are some of the highlights.Company news
Grafana 12.3 release: Interactive learning experiences, new and improved logs visualizations, and moreReleaseGrafana
Instrumentation Hub: a guided, scalable way to roll out observability coverage without losing controlGrafana AlloyGrafana CloudKubernetes MonitoringApplication observabilityeBPFOpenTelemetry
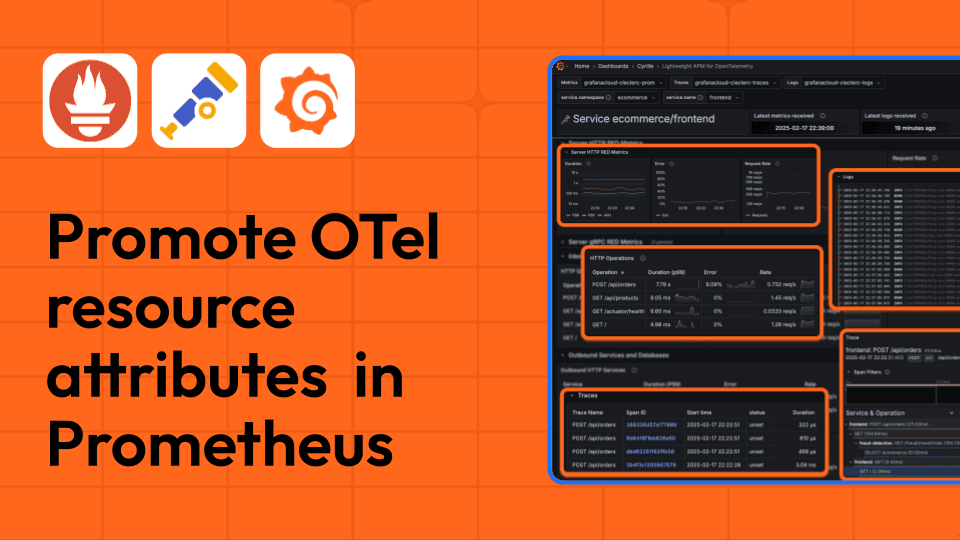
OpenTelemetry with Prometheus: better integration through resource attribute promotionPrometheusOpenTelemetryMimir
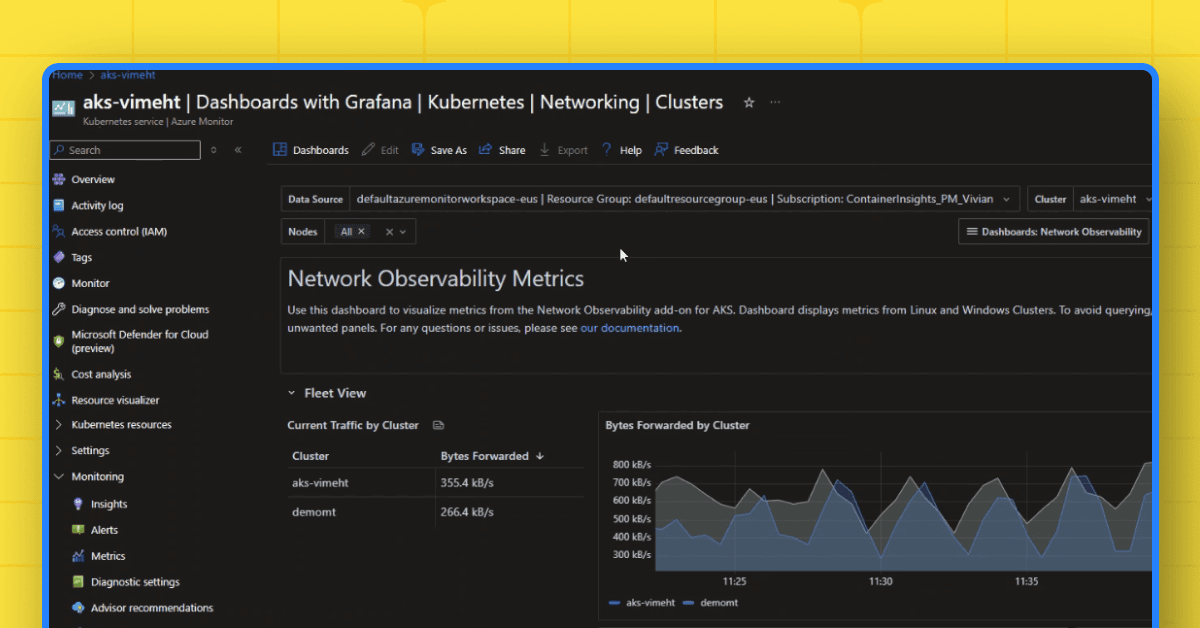
Azure Monitor offers Grafana dashboards natively for immediate real time operational monitoringDashboard
Dashboards and detergent: How two students monitor laundry machines in a college dorm with GrafanaGrafanaVisualizationCommunity
Grafana security update: post-incident review for GitHub workflow vulnerability and what’s nextSecurity
Introducing SCIM provisioning in Grafana: Enterprise-grade user management made simpleGrafanaGrafana EnterpriseGrafana CloudSecurity
Visualize Databricks in Grafana: write custom SQL queries, build interactive dashboards, and morePlugins
Queryless tracing for faster root-cause analysis: Grafana Traces Drilldown is generally availableDrilldownTracing
Grafana Alloy at 1: What’s new and what’s next for our OpenTelemetry Collector distributionGrafana Alloy
Observability as code: automate observability workflows and manage dashboards as code in GrafanaGrafanaDashboard
Grafana 12 release: observability as code, dynamic dashboards, new Grafana Alerting tools, and moreGrafanaRelease
New in Grafana 12: Dynamic dashboards that are smarter, easier to edit, and can be customized for teamsGrafanaDashboard
Reliable, predictable, and scalable performance testing: Grafana k6 1.0 is herek6Performance TestingLoad testing
Introducing OpenTelemetry eBPF Instrumentation: Why we donated Grafana Beyla to OpenTelemetryGrafana BeylaOpenTelemetryeBPF
A context-aware LLM agent built directly into Grafana Cloud: Introducing Grafana AssistantAIGrafana Cloud