
Grafana Cloud updates: The Explore apps suite for queryless data analysis, Adaptive Logs for cost optimization, and more
Note: As of Feb. 20, 2025, the Explore apps (Explore Metrics, Explore Logs, Explore Traces, Explore Profiles) are now the Drilldown apps (Metrics Drilldown, Logs Drilldown, Traces Drilldown, Profiles Drilldown).
We consistently roll out helpful updates and fun features in Grafana Cloud, our fully managed observability platform powered by the open source Grafana LGTM Stack (Loki for logs, Grafana for visualization, Tempo for traces, and Mimir for metrics).
And this month, on the heels of ObservabilityCON 2024 — our flagship observability event — we have no shortage of updates to share. Read on to learn more about the big Grafana Cloud news that came out of ObservabilityCON this year, as well as some other exciting features we’ve recently introduced.
And if you’re not a Grafana Cloud user yet, sign up for an account today! You can try many of these features (and more) for free with our generous Cloud Free plan.
Grafana Cloud updates from ObservabilityCON 2024
The Explore apps suite for a queryless user experience
At Grafana Labs, we want to help everyone derive meaningful insights from their data, whether they’re a seasoned SRE or somebody just starting out on their observability journey.
In line with that effort, we’ve announced public previews of Explore Traces and Explore Profiles, which join Explore Metrics and Explore Logs — now generally available — to create a full suite of Explore apps for Grafana and Grafana Cloud. These apps streamline data exploration and analysis through intuitive, point-and-click UIs, enabling users to drill down and visualize data without having to know query languages like PromQL, LogQL, or TraceQL.

To learn about Explore apps, you can refer to our technical docs.
Contextualized root cause analysis workflows with Asserts
Since acquiring Asserts.ai in 2023, we’ve been hard at work, integrating Asserts technology — which leverages AI/ML to offer an automated approach to correlating anomalies — with Grafana Cloud. And at ObservabilityCON 2024, we shared the results of those efforts.
We introduced a suite of unified workflows connecting Asserts and Grafana Cloud solutions that helps automate the correlation of anomalies across infrastructure and application layers to provide a more cohesive troubleshooting experience. The workflows cover a wide range of monitoring needs, including application performance, Kubernetes workload monitoring, infrastructure monitoring, real user monitoring, and simplified SLO management.
We’ve started rolling out these new capabilities, and by Oct. 2, all Grafana Cloud Advanced customers will have access to Asserts and these integrated workflows from the Grafana Cloud navigation menu. (Note: Kubernetes Monitoring in Grafana Cloud will be required to run Asserts. Our system will automatically analyze your setup and guide you through the onboarding process.)

You can learn more about Asserts in our technical documentation.
Cost optimization with Adaptive Logs
Adaptive Logs, which helps users lower their observability costs by reducing the volume of unnecessary logs, is now generally available in all Grafana Cloud tiers.
Adaptive Logs works by identifying commonly ingested log patterns and creating a set of customized sampling recommendations based on how frequently those patterns are queried. This gives you the ability to prune away low-value logs so you only retain the important ones.

Adaptive Logs builds on the momentum of Adaptive Metrics, which has helped users see a 35% reduction in metrics costs, on average. Both Adaptive Logs and Adaptive Metrics leverage AI/ML techniques to analyze observability data at a scale that wouldn’t be feasible with manual processes.
To learn more, check out our Adaptive Logs docs.
Enhanced monitoring and testing capabilities
Synthetic monitoring and load testing
Earlier this year, we introduced a revamped version of Grafana Cloud Synthetic Monitoring powered by Grafana k6 to enable users to simulate the most complex transactions and user journeys. At ObservabilityCON, we announced the unification of Synthetic Monitoring and k6 with a focus on making authoring tests easy with three new features in Grafana Cloud:
- k6 Studio: A GUI-based, low-code test authoring tool you can use to create tests without hand-scripting in JavaScript. (Experimental)
- Scripted Monitoring: A feature that lets you perform comprehensive black-box synthetic monitoring of services using JavaScript. (Public Preview)
- Browser Monitoring: The ability to run a real browser, render the entire web page, and capture Web Vital metrics, screenshots, and timings to validate the full frontend user experience. (Generally Available in Grafana Cloud k6, and coming soon to Synthetic Monitoring.)
Multi-cloud monitoring with Cloud Provider Observability
Managing multi-cloud environments often means juggling different monitoring tools for each provider, leading to increased complexity and operational overhead. To address those challenges, we announced that Cloud Provider Observability — an application for monitoring AWS, Microsoft Azure, and Google Cloud services, all in Grafana Cloud — is now generally available. Cloud Provider Observability simplifies multi-cloud monitoring and provides more comprehensive insights across cloud services with a single, out-of-the-box observability solution that is easy to set up and scale.
New options for data visualization
We’re always working on new, innovative ways to help our users visualize and gain insights into their data. This month, we have several Grafana Cloud updates related to our canvas, bar gauge, and table visualizations.
Support for canvas actions
We’ve updated canvas visualizations so that now you can add actions — specifically, API calls — to canvas elements. The Selected element configuration now includes a Data links and actions section where you can add actions to elements. Each action can be configured to call an API endpoint, and can be triggered with a single click. To enable this functionality, select Action under the one One-click section in the Selected element data links and actions option.
Legend support in bar gauges
Bar gauge visualizations now support legends, which help you identify and interpret data. You can customize legends by navigating to the Legend section in panel options (by default, the legend is disabled). To better support the legend integration, we’ve added the ability to hide names in each bar gauge. To do that, choose Hidden in the in Name placement option.

Improved cell inspect in tables
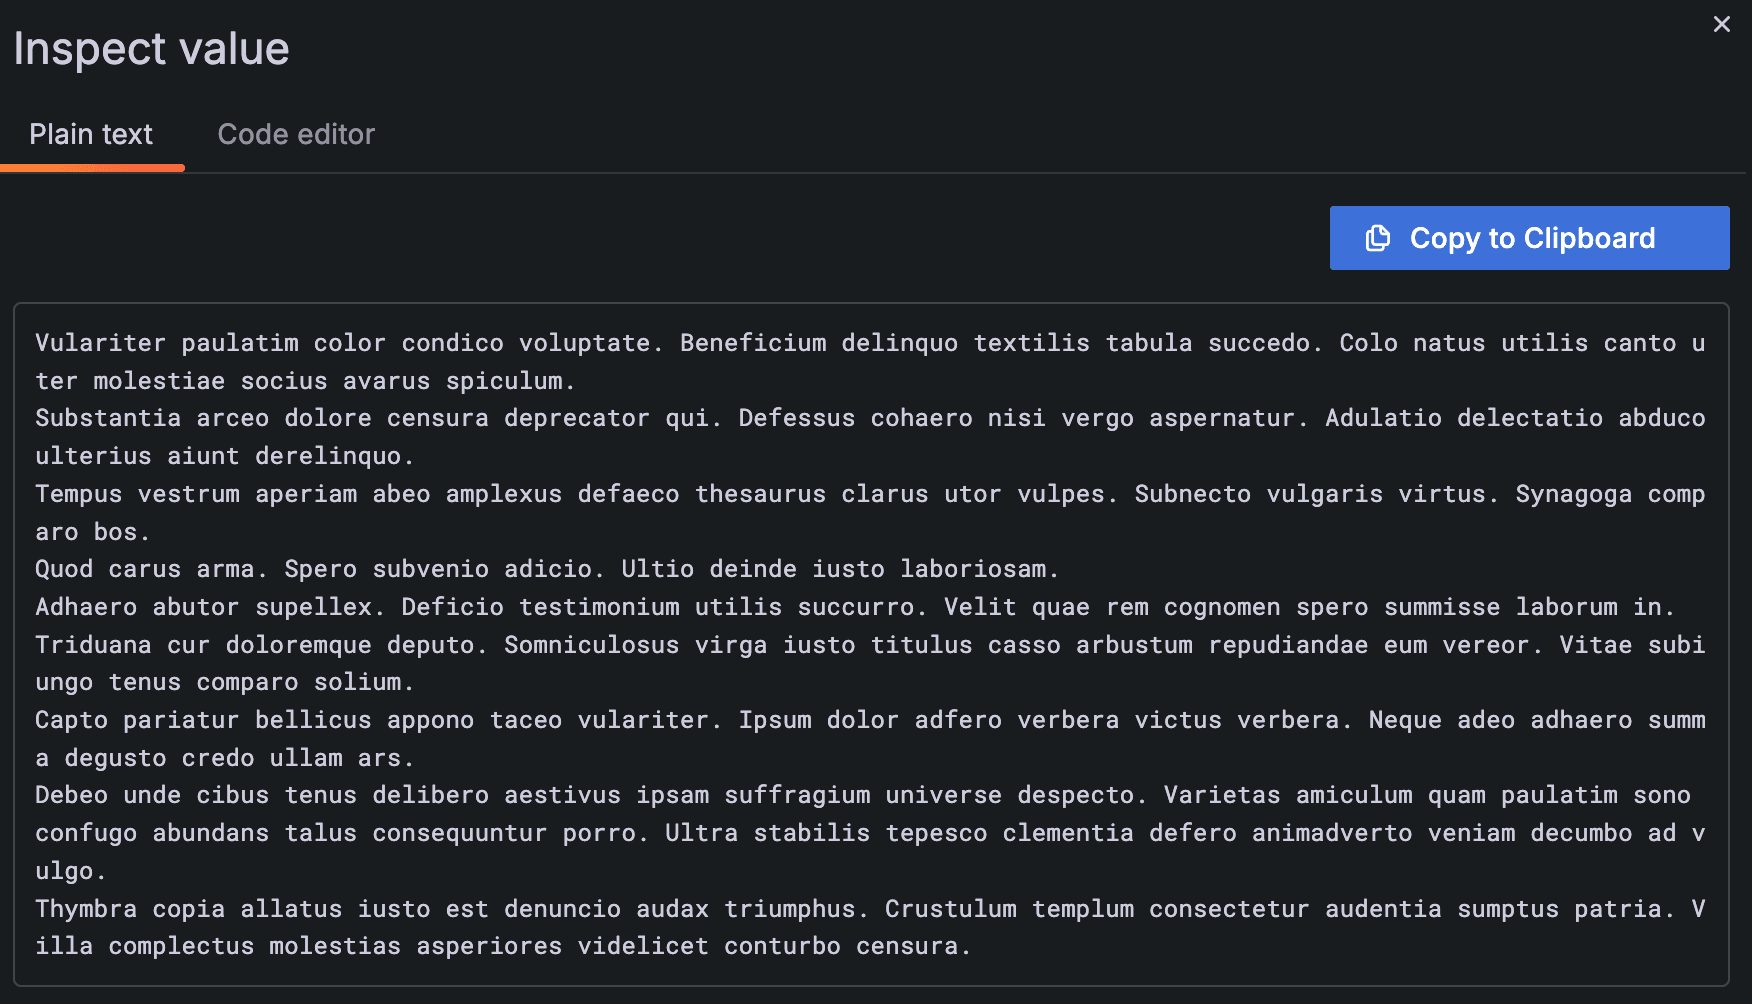
We’ve improved the experience of inspecting values in table visualizations with the addition of tabs in the Inspect value drawer: Plain text and Code editor.
When the Cell inspect value switch is toggled on, clicking the inspect icon in a cell opens the drawer. Grafana attempts to automatically detect the type of data in the cell and opens the drawer with the associated tab showing, but you can also switch back and forth between tabs.
Enhancements to Grafana OnCall and Grafana IRM
A recent round of updates to Grafana OnCall and Grafana IRM help streamline the incident response and management process, and improve the overall end user experience.
New homescreen for Grafana OnCall mobile app
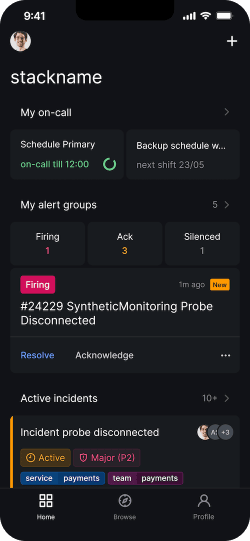
When an incident occurs, every second counts. That’s why we’ve rolled out a new, centralized home screen for the Grafana OnCall mobile app that gives you an at-a-glance overview of everything you need as soon as you open the app.
Whether you’re checking your on-call schedule, monitoring active incidents, or managing alert groups, everything is now front and center, making the app more streamlined for your daily use. With the new home screen you can instantly view primary and backup on-call schedules, quickly monitor which alerts are being fired, and scan through active incidents and their severity.
To learn more about the new Grafana OnCall mobile app homepage, check out our docs.
Improved onboarding for Grafana OnCall
We’ve streamlined the onboarding process for Grafana OnCall, making it quicker and easier for new users to get started.
Grafana OnCall initialization has been moved to the backend, reducing setup time and minimizing potential errors. New users can now access Grafana OnCall immediately without waiting for an admin to log in. Additionally, user synchronization between Grafana and OnCall is significantly faster, so newly created users can start using Grafana OnCall within minutes — no delays, and no extra steps.
Learn more about how to get started with Grafana OnCall.
Unified Slack integration for Grafana IRM
With our newly enhanced Grafana IRM Slack integration, you can incorporate your Slack workspace directly into your incident response workflow, allowing your team to focus on alert resolution with less friction. Previously, you needed to install and configure separate Slack integrations for Grafana OnCall and Grafana Incident. With this update, we’ve unified and rebranded the Grafana OnCall Slack app as the Grafana IRM Slack app, now equipped with incident management features. As part of this change, the legacy Incident Slack integration is being deprecated.
Read more in our technical docs.
UI and user experience improvements
To improve the user experience in Grafana Cloud, including for admins, we recently introduced a new announcement banner and bookmark section.
Announcement banner for admins
Grafana admins can now communicate critical information to users via an announcement banner at the top of the Grafana interface. With this new feature, admins can immediately inform users of important updates, maintenance schedules, and more directly within Grafana, rather than having to use email or Slack.

Navigation bookmarks
Grafana Cloud navigation now includes a Bookmarks section, where you can quickly and easily access all of your favorite pages.

Grafana Cloud integrations and data source plugins
We’re always expanding and updating our line-up of Grafana Cloud integrations. Some of the latest updates include:
- A new AI Observability integration is available to monitor Gen AI requests and usage
- Extensive updates to the Kafka integration, with refactored dashboards and extensive support for JMX metrics from a variety of sources
- An updated JVM integration that supports universal dashboards and alerts across JMX exporter, OTel JVM process metrics, and Spring Boot’s micrometer collector
- A new Beyla integration to monitor the eBPF-based application auto-instrumentation tool
- Kubernetes support has been added for Apache Hadoop and Varnish Cache integrations
We also recently released the Amazon Aurora data source for Grafana, which allows you to create alerts and query and visualize Aurora data within Grafana.
Grafana Cloud is the easiest way to get started with metrics, logs, traces, dashboards, and more. We have a generous forever-free tier and plans for every use case. Sign up for free now!

