‘Grafana’s Big Tent’ podcast: Prometheus 3.0, native histograms, and the future of metricsPodcastsPrometheus
Prometheus native histograms in Grafana Cloud: Get more precision from your Grafana visualizations Grafana CloudPrometheusMimir
How to import Prometheus-style alerts and recording rules to Grafana-managed alerts and recording rulesAlertingPrometheusGrafana
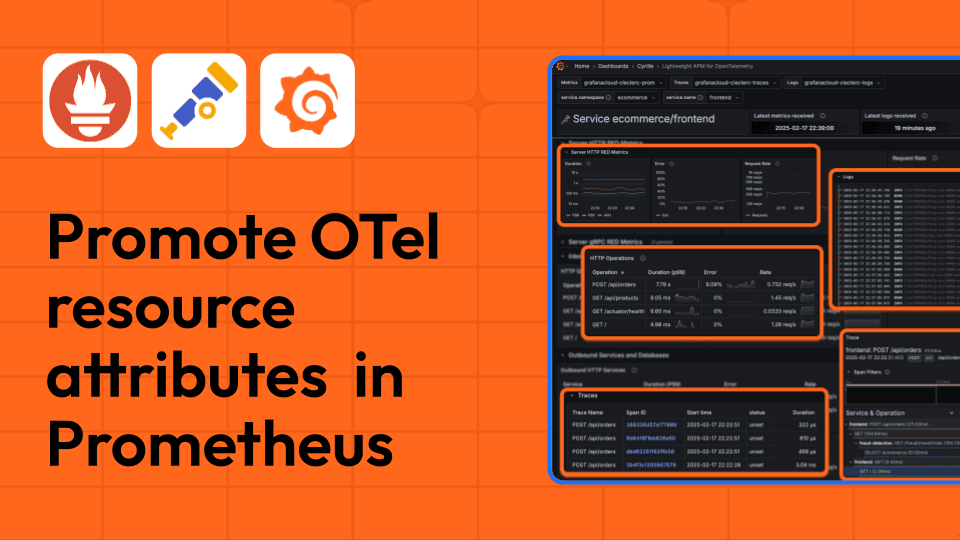
OpenTelemetry with Prometheus: better integration through resource attribute promotionPrometheusOpenTelemetryMimir
Prometheus native histograms in Grafana Cloud: More precise, easier to use, and better compatibilityPrometheusGrafana Cloud
Grafana Loki 101: How to ingest logs with Alloy or the OpenTelemetry CollectorLokiPrometheusGrafana AlloyVideo
How to use OpenTelemetry and Grafana Alloy to convert delta to cumulative at scaleOpenTelemetryPrometheusGrafana Alloy
Prometheus 3.0 and OpenTelemetry: a practical guide to storing and querying OTel dataPrometheusOpenTelemetryOpen Source
Grafana’s Prometheus libraries: How we built libraries to create a truly vendor-neutral data sourcePrometheusAWSPlugins
How to use Prometheus to efficiently detect anomalies at scaleAssertsIncident Response & ManagementPrometheus
How to set up an open source database monitoring stack with Grafana CloudOpen SourceGrafana AlloyGrafana CloudPrometheus
Translate Datadog metrics into OTLP with the OpenTelemetry Collector and Grafana AlloyOpenTelemetryPrometheusMimir
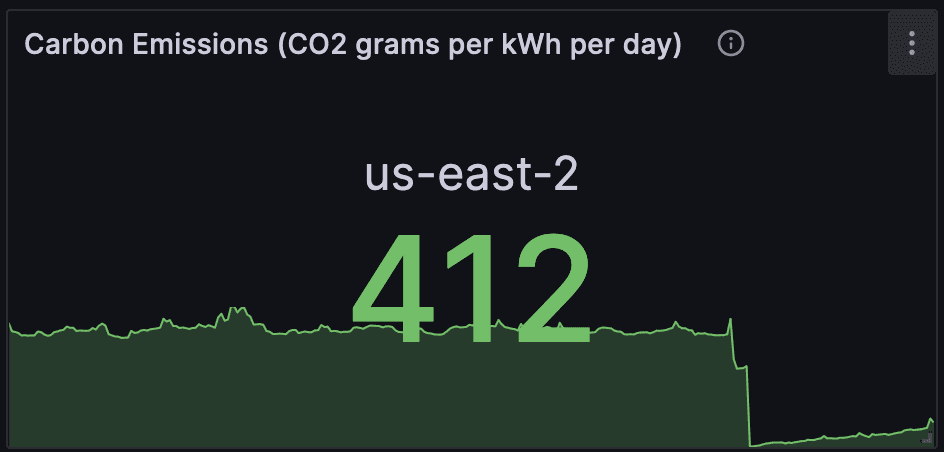
Going green: How to monitor your cloud carbon footprint using Kepler, Prometheus, and GrafanaSustainabilityGrafanaPrometheusEvents
Grafana Labs at KubeCon: eBPF, sustainability, Prometheus, and moreKubeConKuberneteseBPFPrometheusEventsSustainability
Inside TeleTracking’s journey to build a better observability platform with Grafana CloudGrafana CloudGrafana Enterprise LogsGrafana Enterprise MetricsPrometheusLokiAdaptive MetricsFrontend observability