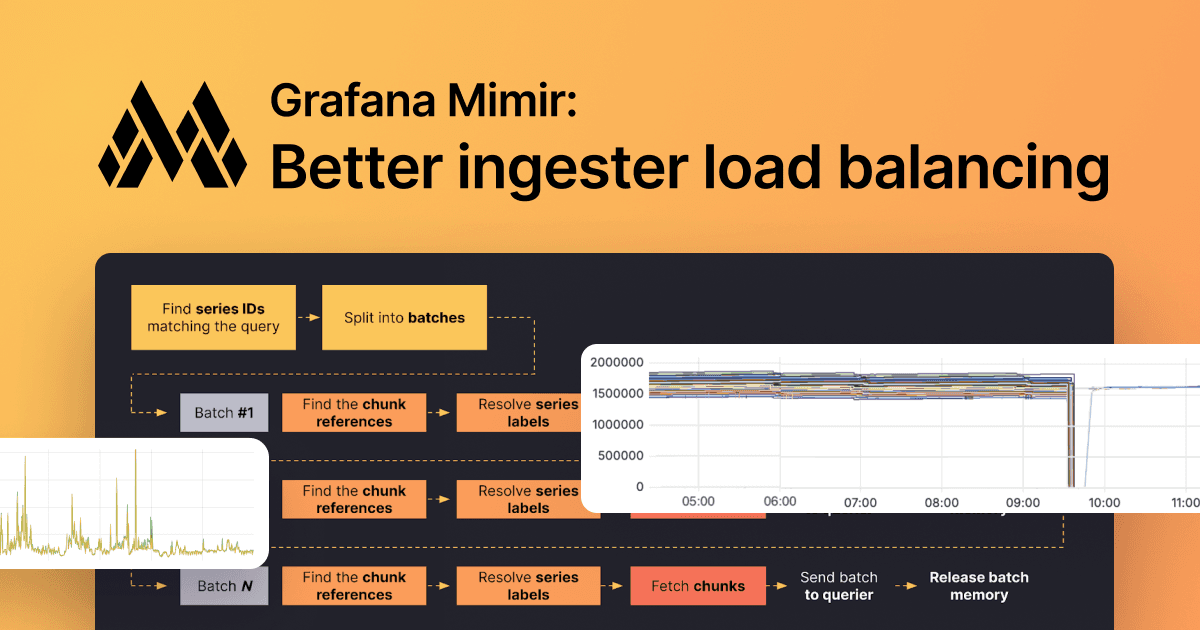
How we improved ingester load balancing in Grafana Mimir with spread-minimizing tokensMimirGrafana Enterprise Metrics
Inside TeleTracking’s journey to build a better observability platform with Grafana CloudGrafana CloudGrafana Enterprise LogsGrafana Enterprise MetricsPrometheusLokiAdaptive MetricsFrontend observability
A year in Mimir: Massive scale, new metrics formats, increased adoptionGrafana Enterprise MetricsMimir
Scaling Grafana Mimir to 500 million active series on customer infrastructure with Grafana Enterprise MetricsMimirGrafana Enterprise Metricsk6
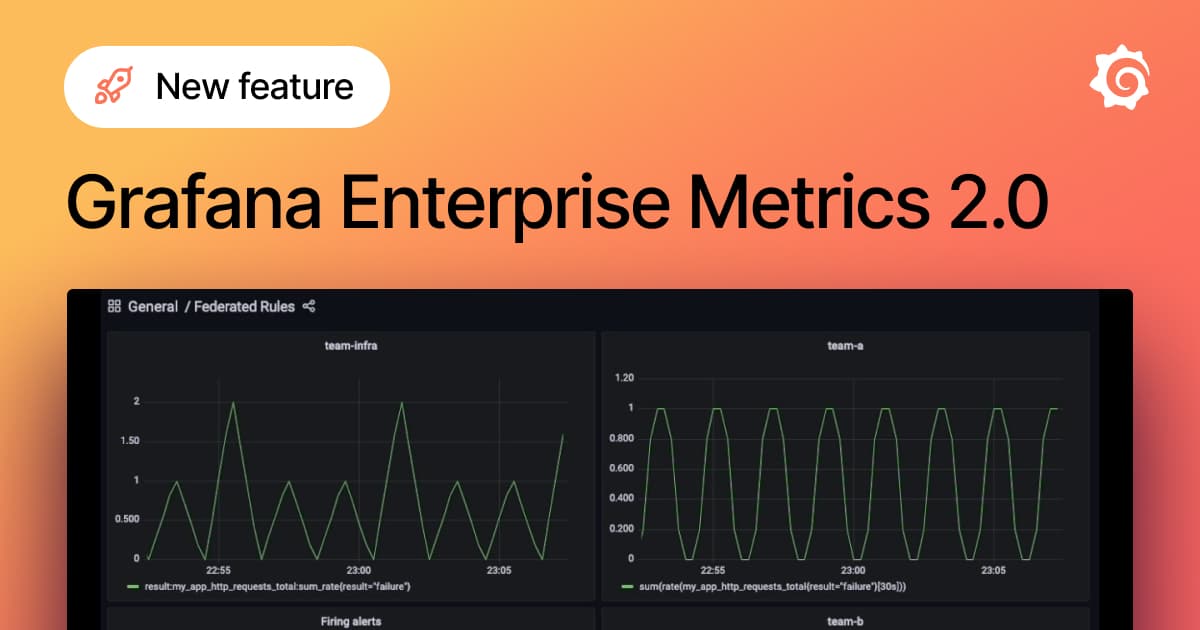
New in Grafana Enterprise Metrics 2.0: Cross-tenant alerting and recording rulesGrafana Enterprise MetricsAlerting
How product teams can manage their performance using Grafana, Prometheus, and Oracle metricsGrafana Enterprise MetricsGrafanaPrometheusOracle
Grafana Agent 0.20.1 and 0.21.2 released with security fixesReleaseSecurityGrafana AgentGrafana CloudGrafana Enterprise Metrics
Learn about reducing MTTR, scaling metrics, and the real cost of observability in our new webinarsObservabilityGraphitePrometheusGrafana CloudGrafana Enterprise MetricsTempoLoki
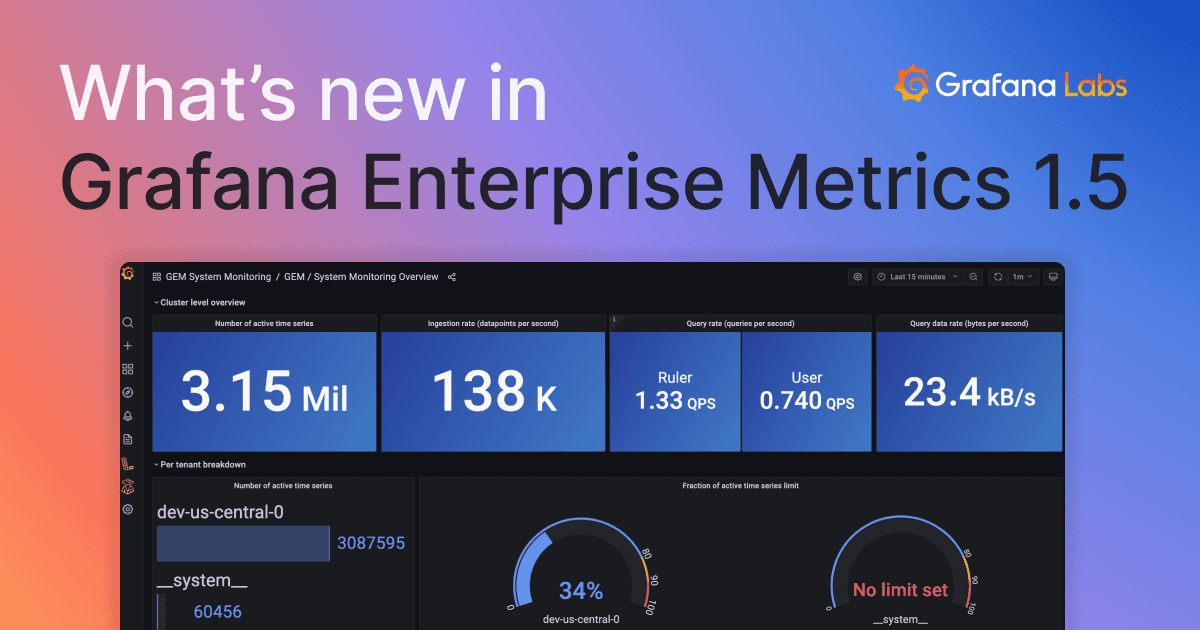
What’s new in Grafana Enterprise Metrics 1.5: Per-tenant usage metrics and a wildcard tenant for queriesGrafana Enterprise MetricsPrometheus
Don’t miss tomorrow’s intro-level webinar on scaling Prometheus and Graphite metrics with GrafanaPrometheusGraphiteGrafanaGrafana Enterprise MetricsGrafana Cloud
How Grafana helps organizations manage SLOs across multiple monitoring data sourcesAlertingGrafana CloudGrafana Enterprise MetricsGrafana
What’s new in Grafana Enterprise Metrics 1.4: Cross-cluster query federation and self-monitoringGrafana Enterprise MetricsPrometheus
GrafanaCONline 2021 Day 5 recap: Grafana alerting, dashboards as code, synthetic monitoring in Grafana Cloud, and more!AlertingGrafanaGrafana CloudGrafana EnterpriseGrafana Enterprise LogsGrafana Enterprise Metrics
What’s new in Grafana Enterprise Metrics 1.3, our scalable, self-hosted Prometheus servicePrometheusPluginsGrafana Enterprise Metrics
Benchmarking Grafana Enterprise Metrics for horizontally scaling Prometheus up to 500 million active seriesMimirPrometheusGrafana Enterprise Metrics
What’s new in Grafana Enterprise Metrics for scaling Prometheus: enhanced access control and a compactor that supports 650 million active series and beyondPrometheusMimirGrafana Enterprise Metrics
Introducing Grafana Metrics Enterprise, a Prometheus-as-a-service solution for enterprise scalePrometheusGrafana Enterprise Metrics