What's new in the Grafana Image Renderer: higher-quality results, security enhancements, and moreGrafanaGrafana CloudDashboard
Contextual, in-product guidance for every Grafana user: A closer look at Interactive LearningGrafanaGrafana Cloud
ObservabilityCON 2025: A guide to all the announcements from Grafana LabsNew in Grafana Cloud: AI-powered incident response, Adaptive Telemetry for cost control, Database Observability, and enterprise-ready security and compliance.ObservabilityCON
From pillars to rings: How interconnected observability in Grafana Cloud optimizes performance and reduces telemetry wasteGrafana Cloud
How to monitor AI agent applications on Amazon Bedrock AgentCore with Grafana CloudAWSIntegrationsAI/ML
Baking in site reliability with observability and AI: How SpotOn uses Grafana Assistant to keep restaurants runningAI/ML
Deletion protection in Grafana Cloud: a simple way to safeguard your observability stackGrafana Cloud
Building on the foundation of OpenTelemetry eBPF Instrumentation: what’s new in Grafana Beyla 2.5 OpenTelemetryeBPF
Grafana Cloud security update: Grafana Cloud Metrics memory corruption issue resolvedMimirGrafana Cloud Metrics
Grafana 12.1 release: automated health checks for your Grafana instance, streamlined views in Grafana Alerting, visualization updates, and moreGrafana
Tracking planes with Grafana in real time: How to visualize the aircraft overhead with your own dashboardGrafana CloudLogging
Securely query data sources on your Tailscale network using Private Data Source Connect in Grafana CloudGrafana Cloud
Grafana Cloud updates: deeper insights in Kubernetes Monitoring, Adaptive Metrics updates, and moreGrafana Cloud
OpenTelemetry at Grafana Labs: the latest on how we’re investing in the emerging industry standardOpenTelemetry
Reaching for the stars: How a Golden Grot Awards winner monitors the International Space Station with GrafanaGolden Grot winnersGolden Grots
Snowflake data visualization: all the latest features to monitor metrics, enhance security, and morePluginsVisualization
Kubernetes Monitoring backend 2.2: better cluster observability through new alert and recording rulesKubernetes MonitoringKubernetes
Enhancing authentication security: Inside Microsoft’s open source contribution to GrafanaSecurityOpen Source
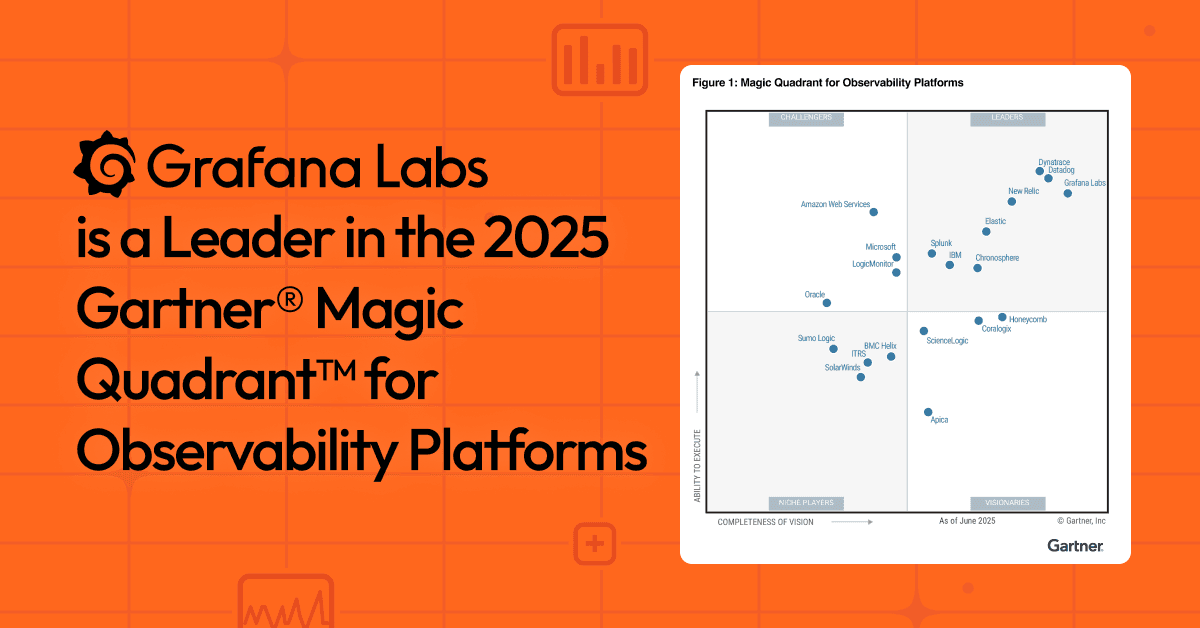
Grafana Labs named a Leader again in the 2025 Gartner® Magic Quadrant™ for Observability PlatformsObservabilityGrafana Cloud
Observability for containerized workloads: How to run Grafana Beyla as a sidecar in Amazon ECSGrafana BeylaGrafana AlloyAWS