2026 observability trends and predictions from Grafana Labs: unified, intelligent, and openAIAdaptive TelemetryOpenTelemetrySLOs
2026 observability trends and predictions from Grafana Labs: unified, intelligent, and openFind out which trends will shape observability in 2026, based on insights from 150 IT decision-makers and the engineers building Grafana Cloud.AIAdaptive TelemetryOpenTelemetrySLOs
Grafana 12.3 release: Interactive learning experiences, new and improved logs visualizations, and moreReleaseGrafana
GrafanaCONline 2022 Day 2 recap: Grafana 9, Grafana Mimir, Grafana Tempo demos, new hackathon projects, and moreGrafanaCon
GrafanaCONline 2022 Day 1 recap: Grafana 9 release, Grafana OnCall open source, Grafana and Grafana Loki in space, and more!GrafanaCon
Introducing Grafana OnCall OSS, on-call management for the open source communityGrafana OnCallOpen Source
Grafana 9.0: Prometheus and Grafana Loki visual query builders, new navigation, improved workflows, heatmap panels, and more!Grafana
What’s next in Kubernetes monitoring, Prometheus histograms, observability, and more: KubeCon EU 2022 in reviewKubeCon
Grafana for business intelligence: How Grafana Labs uses dashboards for more than observability dataGrafanaPlugins
Scaling Grafana Mimir to 500 million active series on customer infrastructure with Grafana Enterprise MetricsMimirGrafana Enterprise Metricsk6
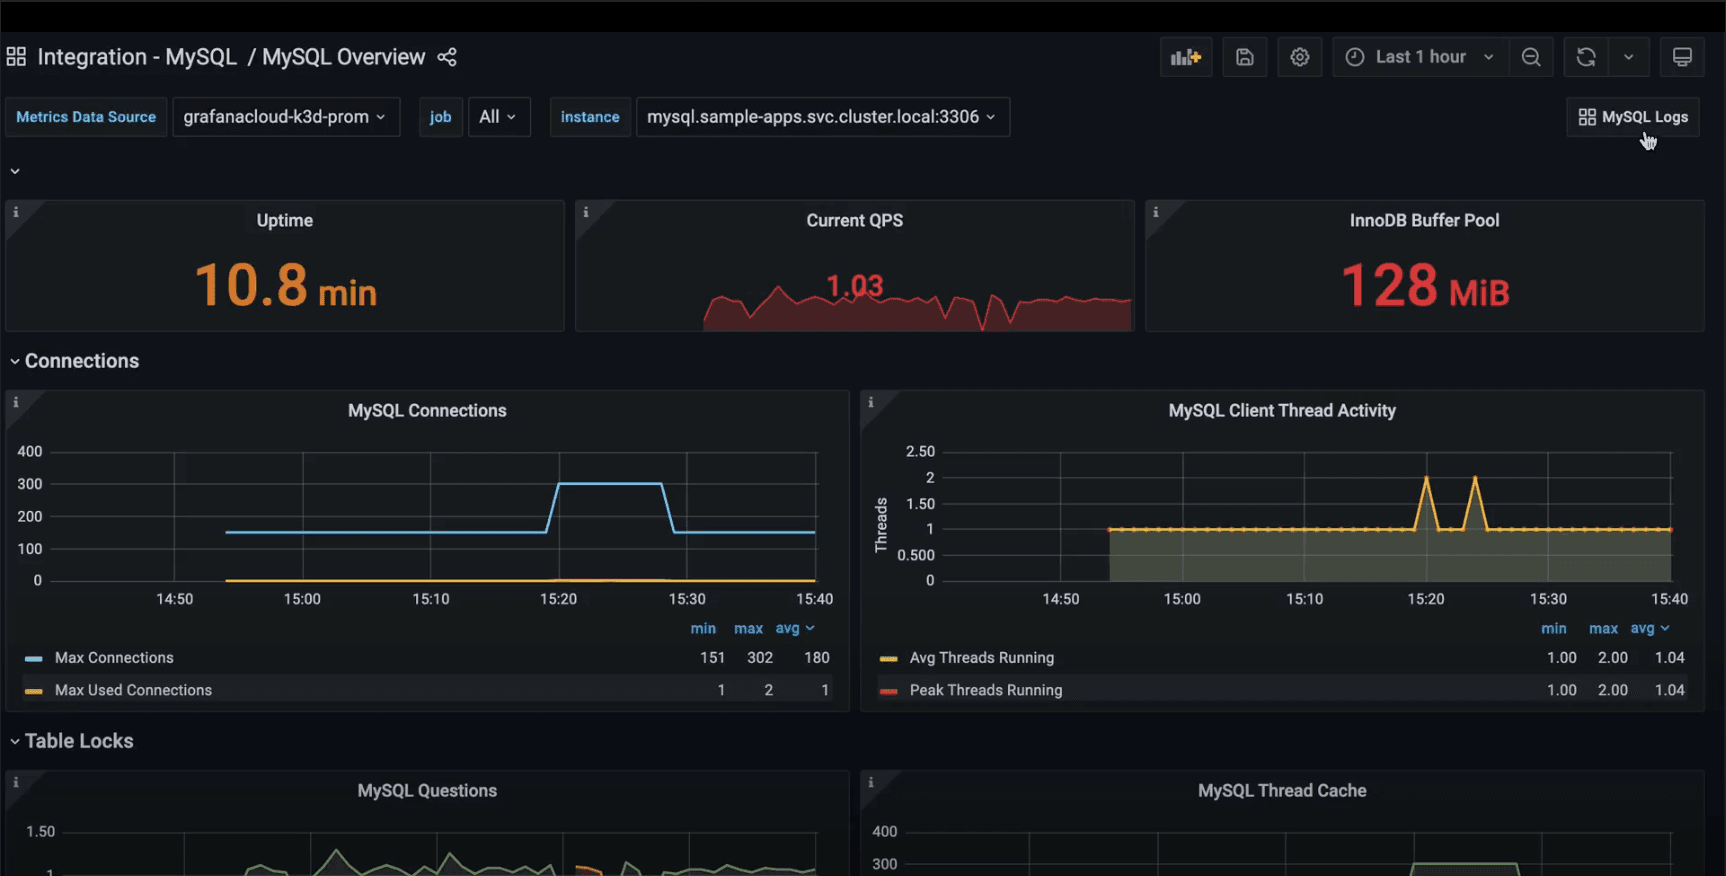
Collect and visualize MySQL server logs with the updated MySQL integration for Grafana CloudIntegrations