
Important: This documentation is about an older version. It's relevant only to the release noted, many of the features and functions have been updated or replaced. Please view the current version.
Splunk data source for Grafana
The Splunk data source allows you to query and visualize Splunk data with Search Processing Language (SPL) or a visual SPL editor.
Requirements
This plugin has the following requirements:
- A Splunk account
- One of the following account types:
- Available for users with a Grafana Cloud Free, Advanced or Trial account or with an activated Grafana Enterprise license.
- If you are using Splunk Cloud, ensure you have port 8089 enabled
Known limitations
There are no known limitations.
Install the data source
To install the data source, refer to Installation.
Configure the data source
To add a data source, refer to Add a data source, and fill in the following fields:
Basic fields
Authentication fields
You can configure custom HTTP header data sources that are managed by Grafana’s provisioning. Doing so allows you to add HTTP headers to all requests that go to that data source. Configure the header name in the jsonData field, and the header value in the secureJsonData field.
Additional Splunk settings
Set queries results limit
To increase the overall app performance it is possible to limit the number of returned results on a few levels. The GF_PLUGIN_GRAFANA_SPLUNK_DATASOURCE_MAX_RESULT_LIMIT environmental variable takes precedence over value set in the data source config, which is above the limit set per query. If not set, the default value is 10000.
Data links
Data links are typically used in Grafana’s explore mode. The data displays a link that allows you to associate data internally with other Grafana data sources, or externally with data via a URL.
Set up a data link by clicking the + Add button under the Data links header in data source settings.
Configure the data source with provisioning
It is possible to configure data sources using config files with Grafana’s provisioning system. You can read more about how it works and all the settings you can set for data sources on the provisioning docs page
apiVersion: 1
datasources:
  - name: Splunk
    type: grafana-splunk-datasource
    access: proxy
    basicAuth: true
    basicAuthUser: user
    editable: true
    enabled: true
    jsonData:
      advancedOptions: true
      fieldSearchType: quick
      internalFieldsFiltration: true
      tlsSkipVerify: true
      variableSearchLevel: fast
      previewMode: false
      clusteringStrategy: 1
      maxResultCount: 999
    secureJsonData:
      basicAuthPassword: password
    url: splunk url
    version: 1
Query the data source
Query editor support two modes: spl and visual. To switch between these modes click hamburger icon at the right side of editor and select Toggle Editor Mode.
SPL mode
Use SPL mode by querying with Search Processing Language (SPL). Find more information on SPL here.
For time series data use timechart command. For example:
index=os sourcetype=cpu | timechart span=1m avg(pctSystem) as system, avg(pctUser) as user, avg(pctIowait) as iowait
index=os sourcetype=ps | timechart span=1m limit=5 useother=false avg(cpu_load_percent) by process_name
Grafana is a time-series-oriented application, and your search query returns time-series data (in the form of a timestamp and value, or a single value). Find more information about the timechart command, refer to timechart. For more search query examples, refer to Splunk® Enterprise Search Reference.
Splunk metrics and mstats
Splunk 7.x provides an mstats command for analyzing metrics, which you need to combine with the timeseries command for it to work properly. You must also set the prestats=t option.
Current syntax:
| mstats prestats=t avg(disk.disk_ops.read) avg(disk.disk_ops.write) WHERE index="collectd" by metric_name span=1m
| timechart avg(disk.disk_ops.read) avg(disk.disk_ops.write) span=1m

Deprecated syntax:
| mstats prestats=t avg(_value) AS Value WHERE index="collectd" metric_name="disk.disk_ops.read" OR metric_name="disk.disk_ops.write" by metric_name span=1m
| timechart avg(_value) span=1m by metric_name
For more information about the mstats command, refer to Splunk’s mstats documentation.
Format as
There are two supported result format modes - Time series (default) and Table. Table mode is suitable for using with a table panel when you want to display aggregated data. That works with raw events (returns all selected fields) and stats search function, which returns table-like data. Results are similar to Statistics tab in Splunk UI. Examples:
index="_internal" sourcetype="scheduler" | fields host, sourceindex="_internal" sourcetype="splunkd_access" | stats avg(bytes) as bytes, avg(file) as file by statusRead more about stats function usage in Splunk Search Reference
Visual mode
This mode provide visual step-by-step search functionality. This mode creates timechart splunk search by selecting an index, source type, and metrics, and set split by fields as needed.
Metric
You can add multiple metrics to search by clicking plus button at the right side of metric row. Metric editor contains list of frequently used aggregations, but you can specify here any other function.
- Select or type an aggregation type. The default is
avg. - Select or type a field for the aggregation to use.
- (Optional) Fill out an alias.
Split by and where
You need to be using Time series mode to use Split by.
Select which fields to split by (these can be removed by selecting remove in the dropdown).
Click the + button after Where to select a where clause type. Each function in the where clause can be edited after selecting a where clause type (remove the where clause by selection remove in the comparator function)
Find out more at here.
Options
To learn more about timechart options, refer to timechart.
Annotations
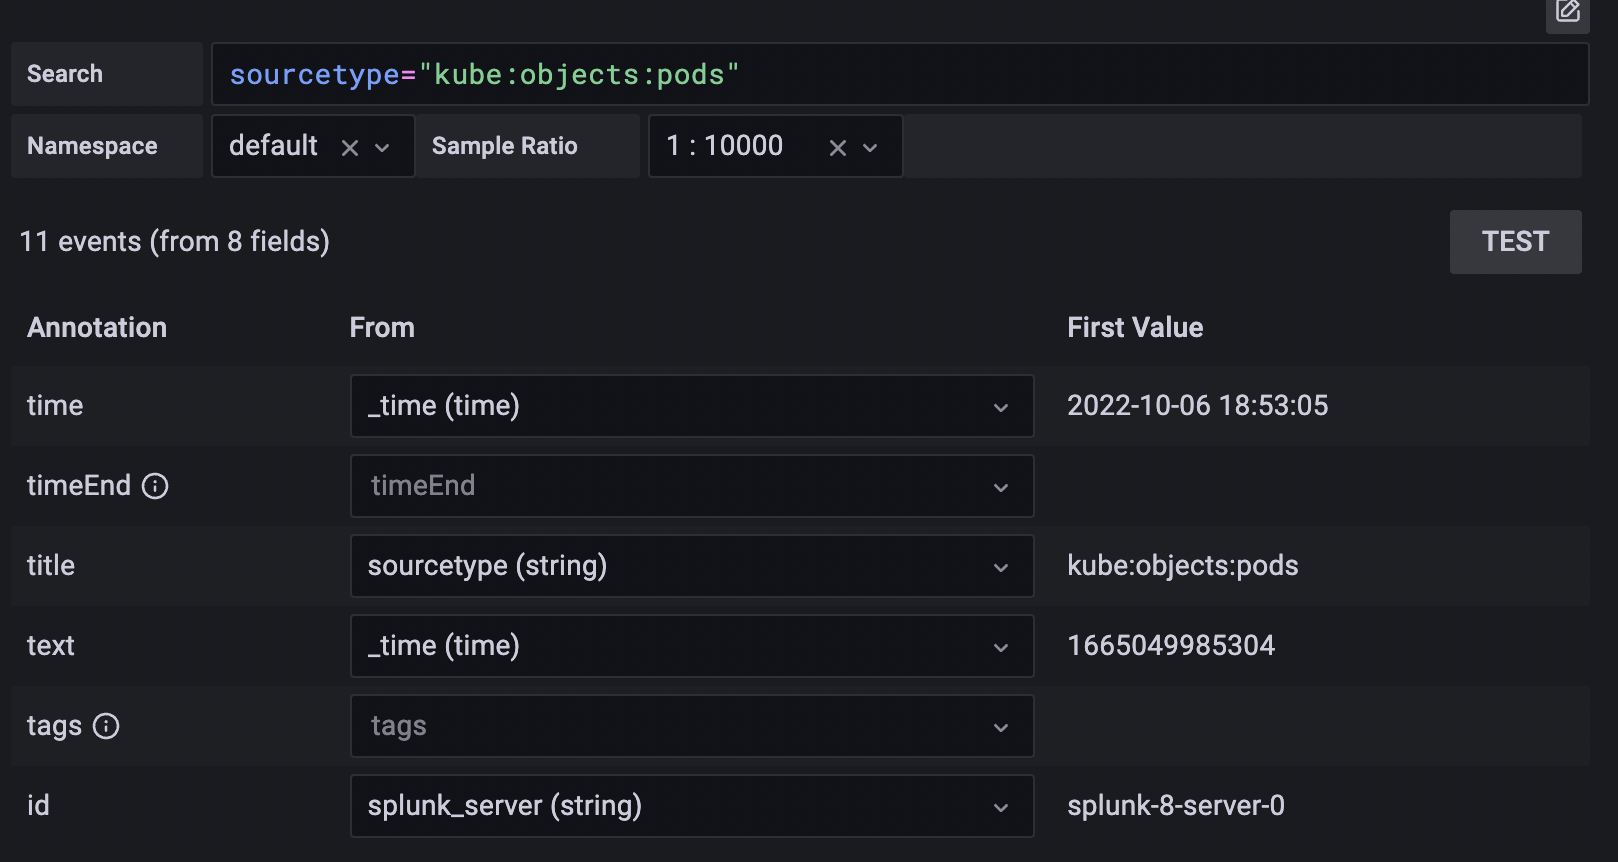
Use annotations if you want to show Splunk alerts or events on graph. Annotation can be either predefined Splunk alert or regular splunk search. Select the desired fields to display in annotation. Annotation text will be displayed as below.

Query limit
Limit field allows limiting the number of returned results. If not specified, a value configured for the data source will be used. Refer to splunk documentation for more details
Splunk alert
Specify alert name or leave field blank to get all fired alerts. Template variables are supported.
Splunk search
Use splunk search to get needed events, for example:
index=os sourcetype=iostat | where total_ops > 400
index=os sourcetype=iostat | where total_ops > $io_threshold
Template variables are supported.
Event field as text option suitable if you want to use field value as annotation text. For example, error message text from logs:
Event field as text: _raw
Regex: WirelessRadioManagerd\[\d*\]: (.*)
Regex allows to extract a part of message.
Templates and variables
To add a new Splunk query variable, refer to Add a query variable. Use your Splunk data source as your data source.
Query with SPL to return list of values, for example with statscommand:
index=os sourcetype="iostat" | stats values(Device)This query returns list of Device field values from iostat source. Then you can use these device names for time series queries or annotations.
There are two possible types of variable queries can be used in Grafana:
- A simple query (as present above) which returns a list of values
- A query that can create a key/value variable. The query should return two columns that are named
_textand_value. The_textcolumn value should be unique (if it is not unique then the first value is used). The options in the dropdown will have a text and value that allows you to have a friendly name as text and an id as the value.
This search returns table with columns Name (Docker container name) and Id (container id):
source=docker_inspect | stats count latest(Name) as Name by Id | table Name, IdIn order to use container name as a visible value for variable and id as it’s real value, query should be modified, like:
source=docker_inspect | stats count latest(Name) as Name by Id | table Name, Id | rename Name as "_text", Id as "_value"Multi-value variables
It’s possible to use multi-value variables in queries. An interpolated search will be depending on variable usage context. There are a number of that contexts which plugin supports. Assume there’s a variable $container with selected values foo and bar:
Basic filter for
searchcommandsource=docker_stats $container => source=docker_stats (foo OR bar)Field-value filter
source=docker_stats container_name=$container
=>
source=docker_stats (container_name=foo OR container_name=bar)
Field-value filter with the
INoperator andin()functionsource=docker_stats container_name IN ($container) => source=docker_stats container_name IN (foo, bar) source=docker_stats | where container_name in($container) => source=docker_stats | where container_name in(foo, bar)
Multi-value variables and quotes
If variable wrapped in quotes (both double or single), its values also will be quoted:
source=docker_stats container_name="$container"
=>
source=docker_stats (container_name="foo" OR container_name="bar")

source=docker_stats container_name='$container'
=>
source=docker_stats (container_name='foo' OR container_name='bar')
After creating a variable it can be used in your Splunk queries by using this syntax.
For more information on variables refer this.
Import a dashboard for Splunk
Follow these instructions for importing a dashboard.
Imported dashboards can be found in Configuration > Data Sources > select your Splunk data source > select the Dashboards tab to see available pre-made dashboards.
See Dashboards for full details on currently available dashboards and their data dependencies.
Dashboards
The following dashboards are currently available:
- Kubernetes overview
- Node overview
- Pod overview
Dependencies
- Splunk 8 - These dashboards have been tested against Splunk 8.2.
- Grafana >= 8.2
- Splunk OpenTelemetry Connector for Kubernetes - For these dashboards to be populated, we require Kubernetes data to be ingested into Splunk. Currently, the dashboards utilize metrics only from this agent - the
otelK8sClusterReceiverandotelAgentdaemonset are required. We recommend using the helm chart provided by Splunk. - Splunk Open Connect - the helm chart can be used to collect Kubernetes events. Currently, the Open Telemetry connector does not collect this data. Once added, this agent will no longer be required.
When opening a dashboard, ensure you select an appropriate metrics and events index. These default to em_metrics and main respectively.
Kubernetes overview
This dashboard provides summary statistics on the cluster concerning capacity, resource utilization and pod state. Users can filter by cluster name and namespace.

Node overview
This dashboard provides summary statistics with respect to nodes in the cluster, allowing users to filter by node and cluster name.

Pod overview
This dashboard provides summary statistics with respect to nodes in the cluster, allowing users to filter by pod and cluster name.

Get the most out of the plugin
- Add Annotations.
- Configure and use Templates and variables.
- Add Transformations.
- Set up alerting; refer to Alerts overview.
Was this page helpful?
Related resources from Grafana Labs


