Databricks data source for Grafana
The Databricks data source allows a direct connection to Databricks to query and visualize Databricks data in Grafana.
This data source provides a SQL editor to format and color code your SQL statements.
Installation
For detailed instructions on how to install the plugin on Grafana Cloud or locally, refer to Install a plugin.
Note
This plugin uses dynamic links for Credentials authentication (deprecated). Grafana suggests using Token authentication instead. The plugin does not work with Credentials authentication when run on bare Alpine Linux. If Token based authentication is not an option and Alpine Linux is a requirement, Grafana recommends using Alpine images.
Watch the following video for information on how to connect Databricks to your Grafana instance and get started exploring and visualizing your data lake.
Manual configuration
Once the plugin is installed on your Grafana instance, follow these instructions to add a new Databricks data source, and enter configuration options.
With a configuration file
You can define and configure the data source in YAML files as part of the Grafana provisioning system. For general information about provisioning in Grafana, refer to Provision data sources.
Following is a provisioning example for the Databricks data source using basic authentication:
apiVersion: 1
datasources:
  - name: Databricks
    type: grafana-databricks-datasource
    jsonData:
      host: community.cloud.databricks.com
      httpPath: path-from-databricks-odbc-settings
    secureJsonData:
      token: password/personal-token
Time series
Time series visualization options are selectable after adding a datetime
field type to your query. This field is used as the timestamp. You can
select time series visualizations using the visualization options. Grafana
interprets timestamp rows without explicit time zone as UTC. Any column except
time is treated as a value column.
Multi-line time series
To create multi-line time series, the query must return at least three fields in the following order:
- field 1:
datetimefield with an alias oftime - field 2: value to group by
- field 3+: the metric values
For example:
SELECT log_time AS time, machine_group, avg(disk_free) AS avg_disk_free
FROM mgbench.logs1
GROUP BY machine_group, log_time
ORDER BY log_time
Templates and variables
To add a new Databricks query variable, refer to Add a query variable.
After creating a variable, you can use it in your Databricks queries by using Variable syntax. For more information about variables, refer to Templates and variables.
Macros
$__interval_long macro
In some cases, you may want to use window grouping with Spark SQL.
Consider the following query:
SELECT window.start, avg(aggqueue) FROM a17
GROUP BY window(_time,  '$__interval_long')
This translates into the following query based on dashboard interval.
SELECT window.start, avg(aggqueue) FROM a17
GROUP BY window(_time,  '2 MINUTE')
Macro examples
The following table shows the macro expansion for the $__interval_long macro when Grafana has a 1m interval.
OAuth configuration
The following sections contain information on OAuth configuration settings.
OAuth Passthrough with Microsoft Entra ID
If you are using OAuth Passthrough with Microsoft Entra ID (formerly Azure Active Directory), complete the following steps:
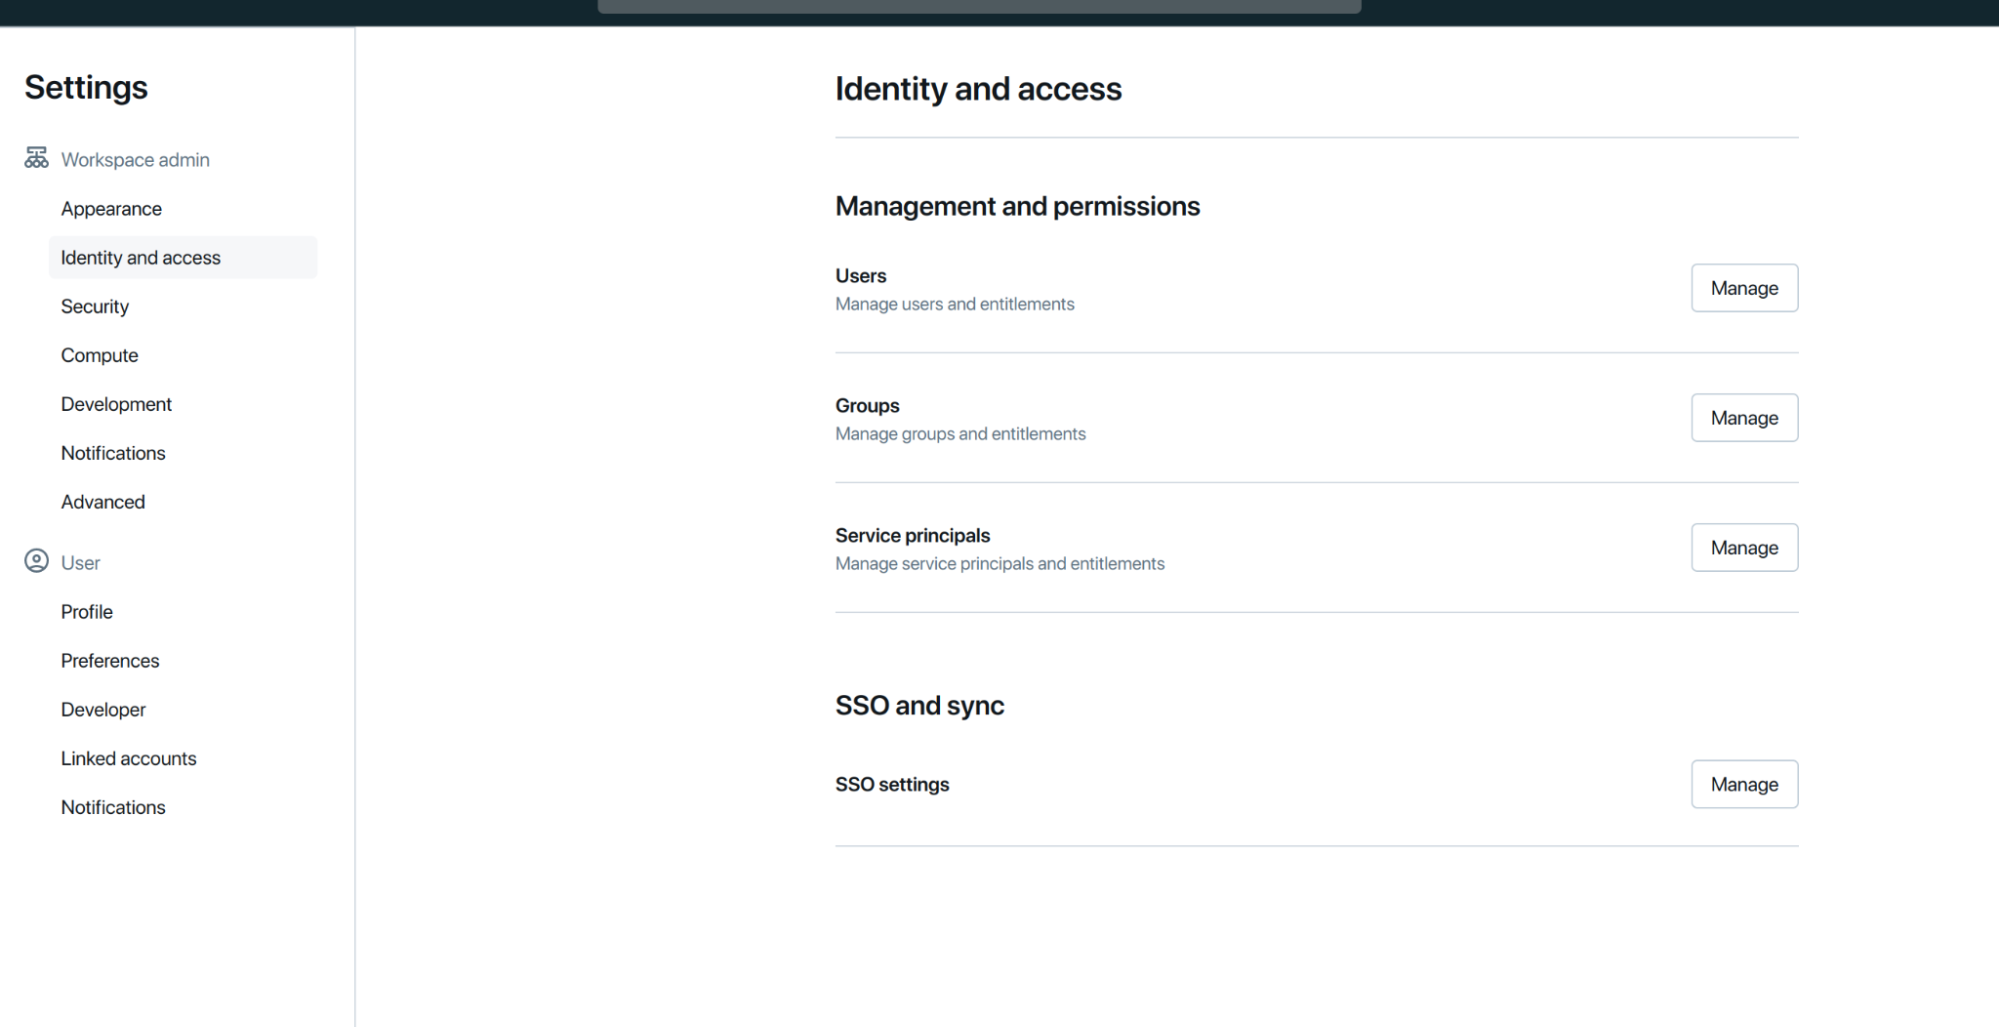
- Go to your Databricks Dashboard as an administrator under Settings > Identity and access > SSO and sync > SSO Settings > Manage:
![Databricks dashboard]()
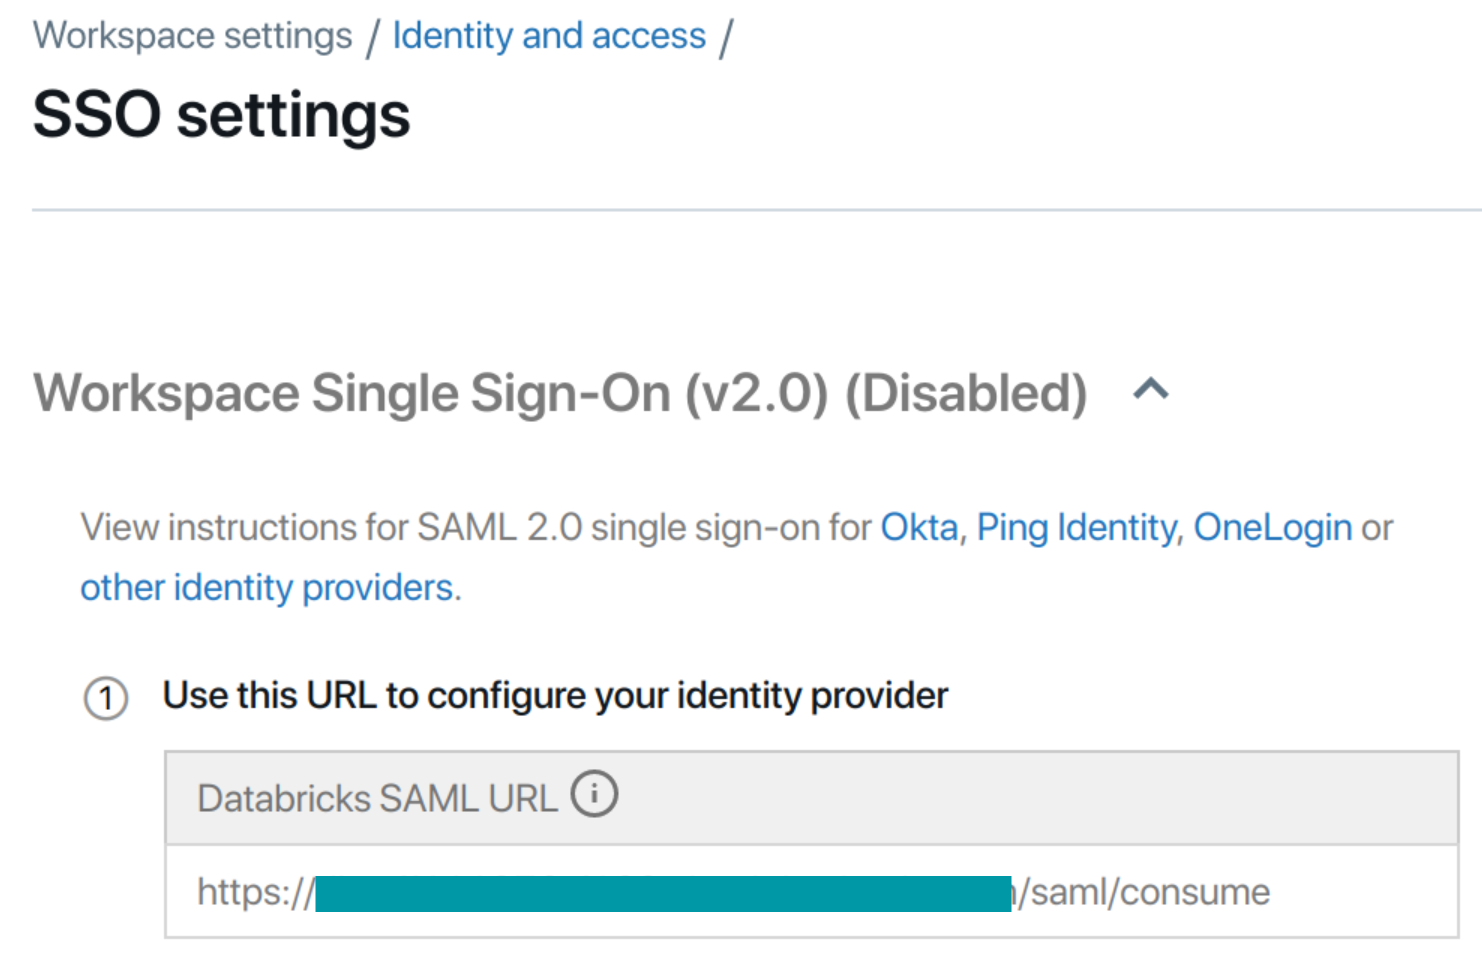
- Copy the Databricks SAML URL. (Don’t close the tab)
![Databricks dashboard]()
- Create your App Registration:
- Go to the Azure Portal
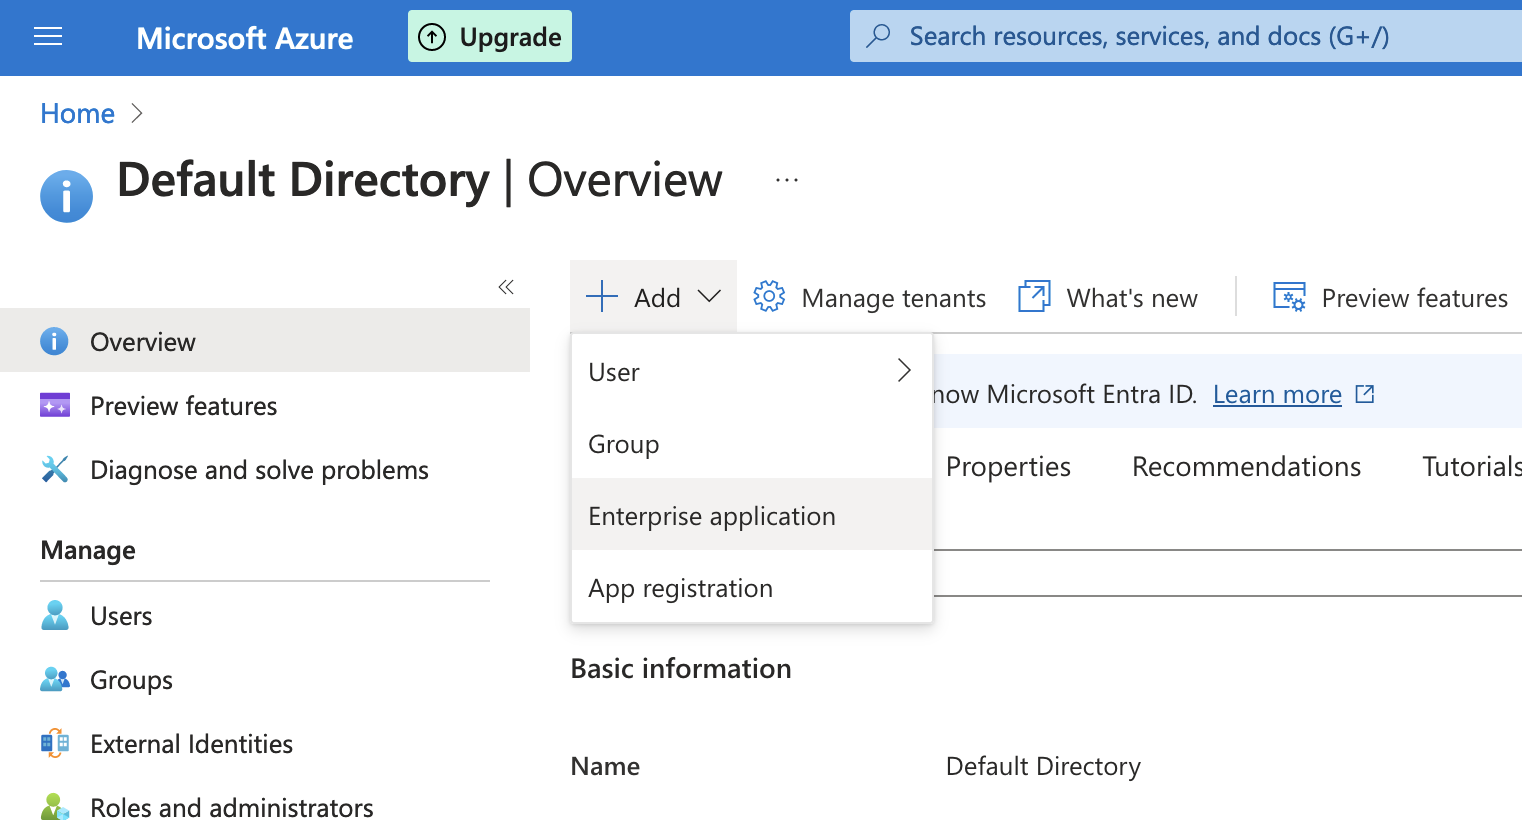
- Microsoft Entra ID > Add > Enterprise Application
![Microsoft Entra ID Add Enterprise Application screen]()
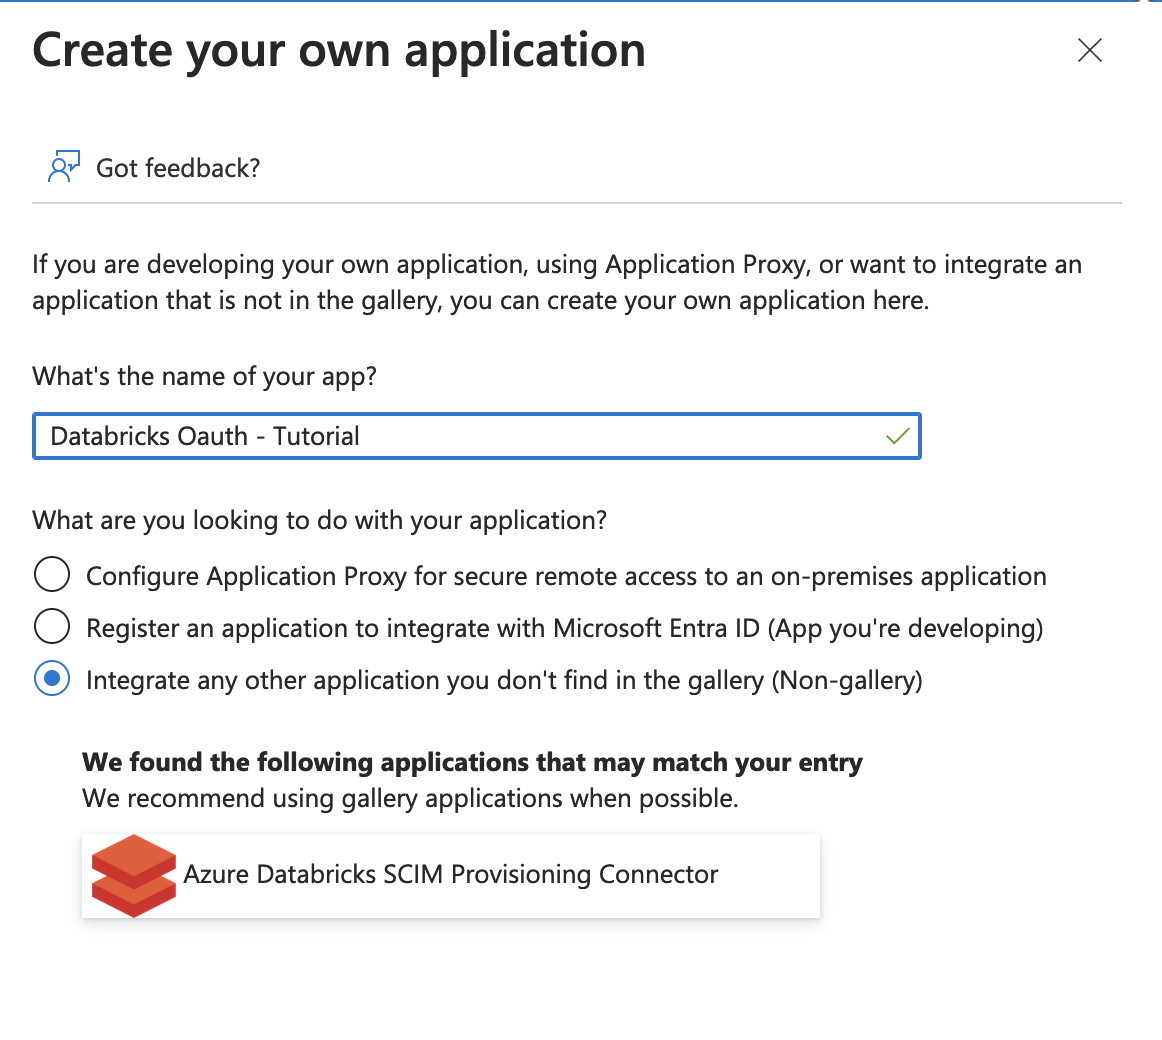
- Enter a name for the application. When asked “What are you looking to do with your application?”, choose Integrate any other application you don’t find in the gallery.
![Databricks create application screen]()
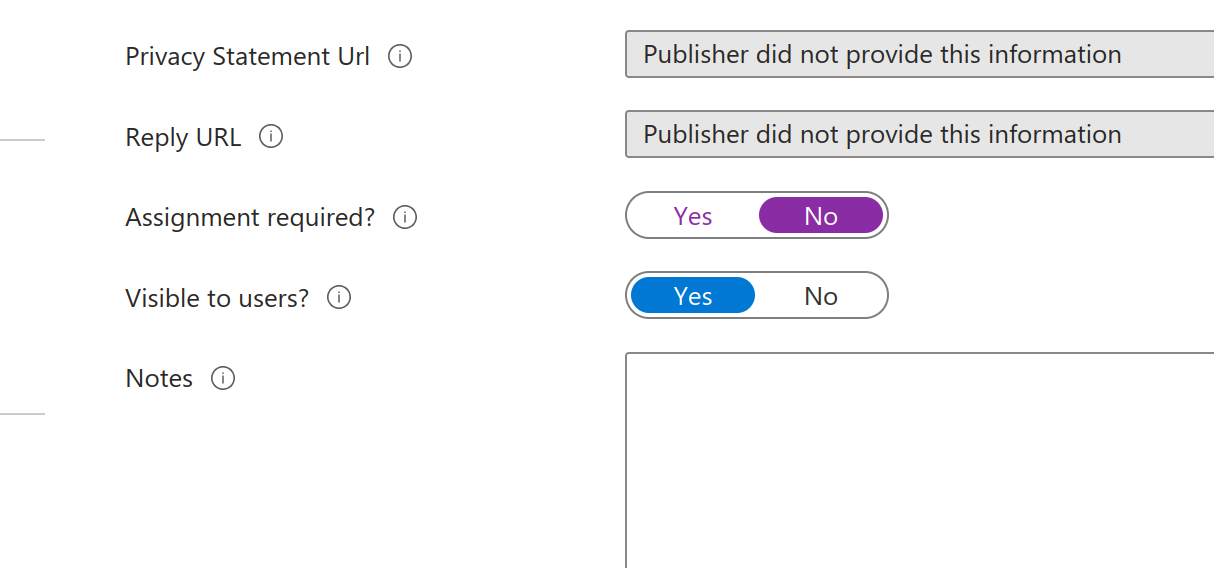
- Under Properties set Assignment Required to NO:
![Databricks create application screen]()
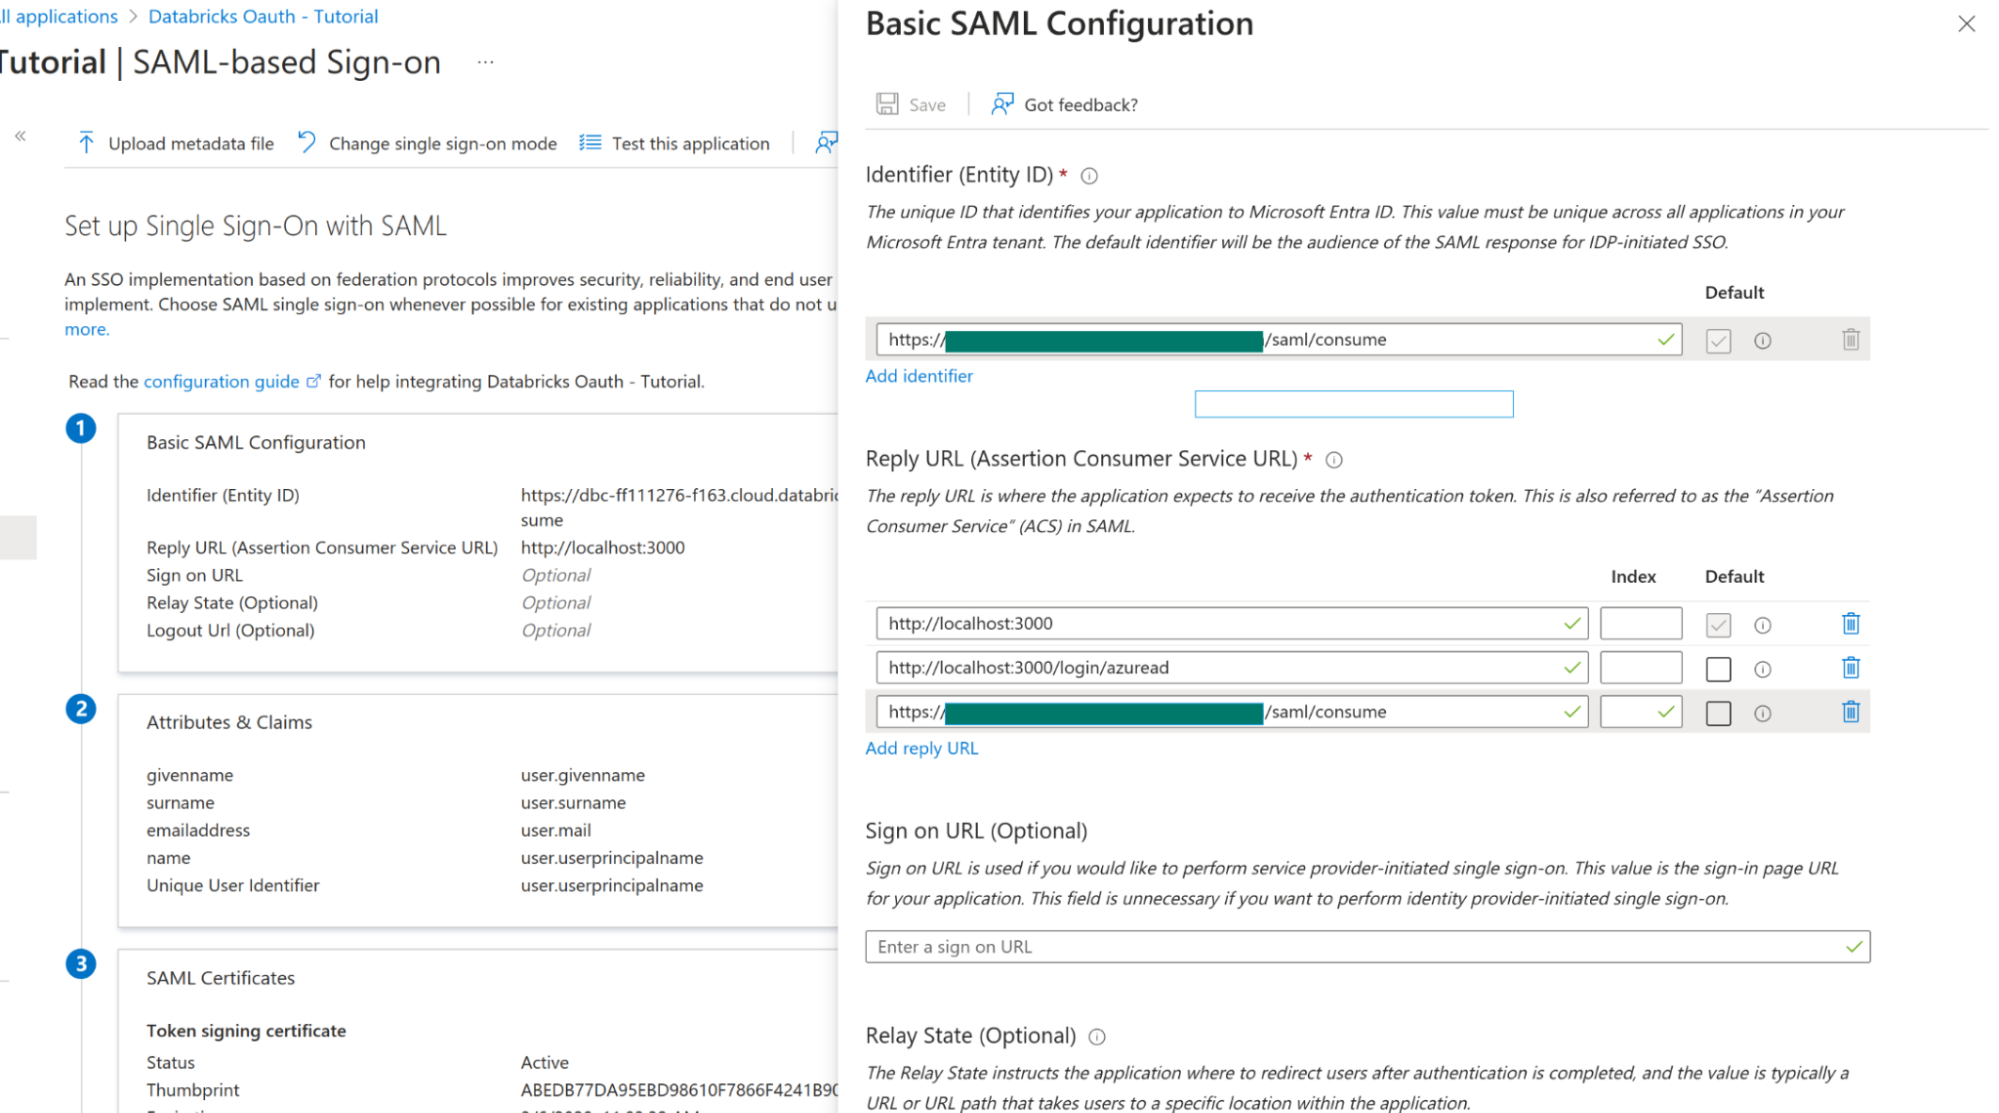
- Under Single-sign on click on SAML and under Basic SAML Configuration click edit:
- Set Identifier ID to the Databricks SAML URL saved from earlier and for Reply URLS set it also to the Databricks SAML URL as well as the Grafana redirect URLs from this guide
![Basic SAML Configuration]()
- Under SAML Sign-in Certificate click Edit and set Sign-in Option to Sign SAML response and assertion. Click Save.
- Under Attributes & Claims click edit. Set the Unique User Identifier (Name ID) field to user.mail
![Basic SAML Configuration]()
- Under SAML Certificates next to Certificate Base 64 click Download. This will download a
.cerfile. Copy the contents for further steps in Databricks. - Also save Login URL and Microsoft Entra ID Identifier for Databricks
- Back in your Databricks SSO Settings tab
- Single Sign-On URL => Login URL (from previous step)
- Identity Provider Entity ID => Microsoft Entra Identifier (from previous step)
- X.509 Certificate => Contents from downloaded certificate
Complete Grafana OAuth setup
- On the Azure Portal go to App Registrations > All Applications and find your application name
- On the overview page note the Application (client) ID. For config in your
conf.inifile this is the Oauth client ID as well of Directory (tenant) ID. - Click on Endpoints:
- Note the OAuth 2.0 authorization endpoint (v2) URL. This is the authorization URL.
- Note the OAuth 2.0 token endpoint (v2). This is the token URL.
- Click Certificates & secrets, then add a new entry under Client secrets with the following configuration.
- Description: Grafana OAuth
- Expires: Never
- Click Add then copy the key value. This is the OAuth client secret.
Define required roles
- Go to Microsoft Entra ID and then to Enterprise Applications.
- Search for your application and click it.
- Click Users and Groups.
- Click Add user/group to add a user or group to the Grafana roles.
- Now go back to Microsoft Entra ID and then to App Registrations. Search for your app and click it.
- Go to App Roles and configure roles like described in here.
- Now Configure AD Oauth in Grafana Configuration file as described in here.
Forward token to users
In your grafana.ini file set:
[azure]
forward_settings_to_plugins = grafana-azure-monitor-datasource, prometheus, grafana-azure-data-explorer-datasource, mssql, grafana-databricks-datasource
Finally, under the data source settings page set the Authentication Type to OAuth Passthrough.
On-behalf-of authentication
On-behalf-of authentication is only applicable to Azure Databricks clusters. It allows individual users to be authenticated using their own credentials via an App Registration configured in Azure with access to Databricks resources.
On-behalf-of authentication is not supported for private clouds (Azure China Cloud, Azure Government Cloud) at this time.
Warning
Avoid setting up alerts if your data source is configured to use on-behalf-of authentication. Alert rules will not function because no user is in scope to supply credentials for the query.
Setup
Configure Grafana to use OAuth2 with Microsoft Entra ID as documented. The
[auth.azuread]scopes(or$GF_AUTH_AZUREAD_SCOPES) must contain “openid email profile offline_access”.ID tokens must be enabled with a checkbox found on the Azure portal under “App Registrations” → the respective application → “Manage” → “Authentication”.
In addition to the “Microsoft Graph”
User.Read, a special “Azure Databricks”user_impersonationpermission must be enabled on the Azure portal under “App Registrations” → the respective application → “Manage” → “API permissions”.Enable “Admin consent” under “App Registrations” → the respective application → “Security” → “Permissions”. Enabling “Admin consent” will grant consent on behalf of all users in the current tenant, ensuring the users will not be required to consent when using the application.
When configuring the data source for an Azure Databricks cluster, the hostname and HTTP path can be found by navigating to your Azure Databricks cluster → SQL Warehouses → Connection details → Server hostname and HTTP path.
Use the Tenant ID, Client ID, and Client secret values for the Application Registration created in step 1.
Unity Catalog support
Unity Catalog is Databricks’ unified governance solution for data and AI assets. The Databricks data source supports Unity Catalog’s three-level namespace: catalog.schema.table.
Enabling Unity Catalog
To enable Unity Catalog support in your Databricks data source:
- Navigate to your Databricks data source configuration page.
- Under the connection settings, find the Unity Catalog Support checkbox.
- Enable the checkbox to activate Unity Catalog features.
- Click Save & Test to verify the connection.

Note
Unity Catalog support requires appropriate permissions in your Databricks workspace. Ensure your authentication token or credentials have access to the catalogs, schemas, and tables you want to query.
Using Unity Catalog
When Unity Catalog support is enabled, the query builder for the Databricks plugin provides separate dropdowns for catalog, schema, and table selection, allowing you to easily navigate your Unity Catalog hierarchy.

The resulting query will be, for example:
SELECT *
FROM mycatalog.myschema.mytable
Explore further
- Add Annotations.
- Configure and use Templates and variables.
- Add Transformations.
- Set up alerting; refer to Alerts overview.


