2026 observability trends and predictions from Grafana Labs: unified, intelligent, and openAIAdaptive TelemetryOpenTelemetrySLOs
2026 observability trends and predictions from Grafana Labs: unified, intelligent, and openFind out which trends will shape observability in 2026, based on insights from 150 IT decision-makers and the engineers building Grafana Cloud.AIAdaptive TelemetryOpenTelemetrySLOs
Grafana 12.3 release: Interactive learning experiences, new and improved logs visualizations, and moreReleaseGrafana
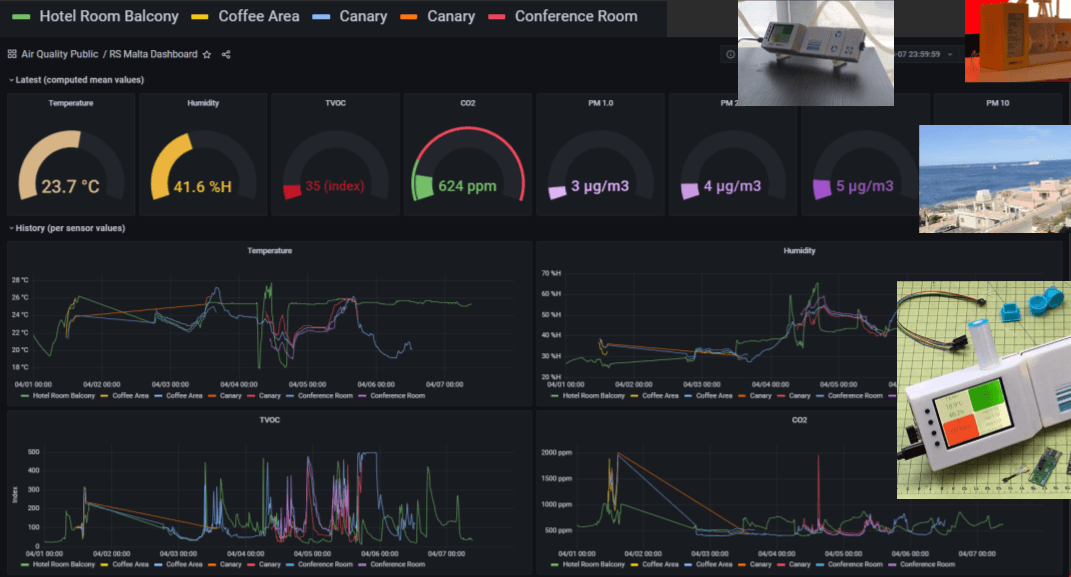
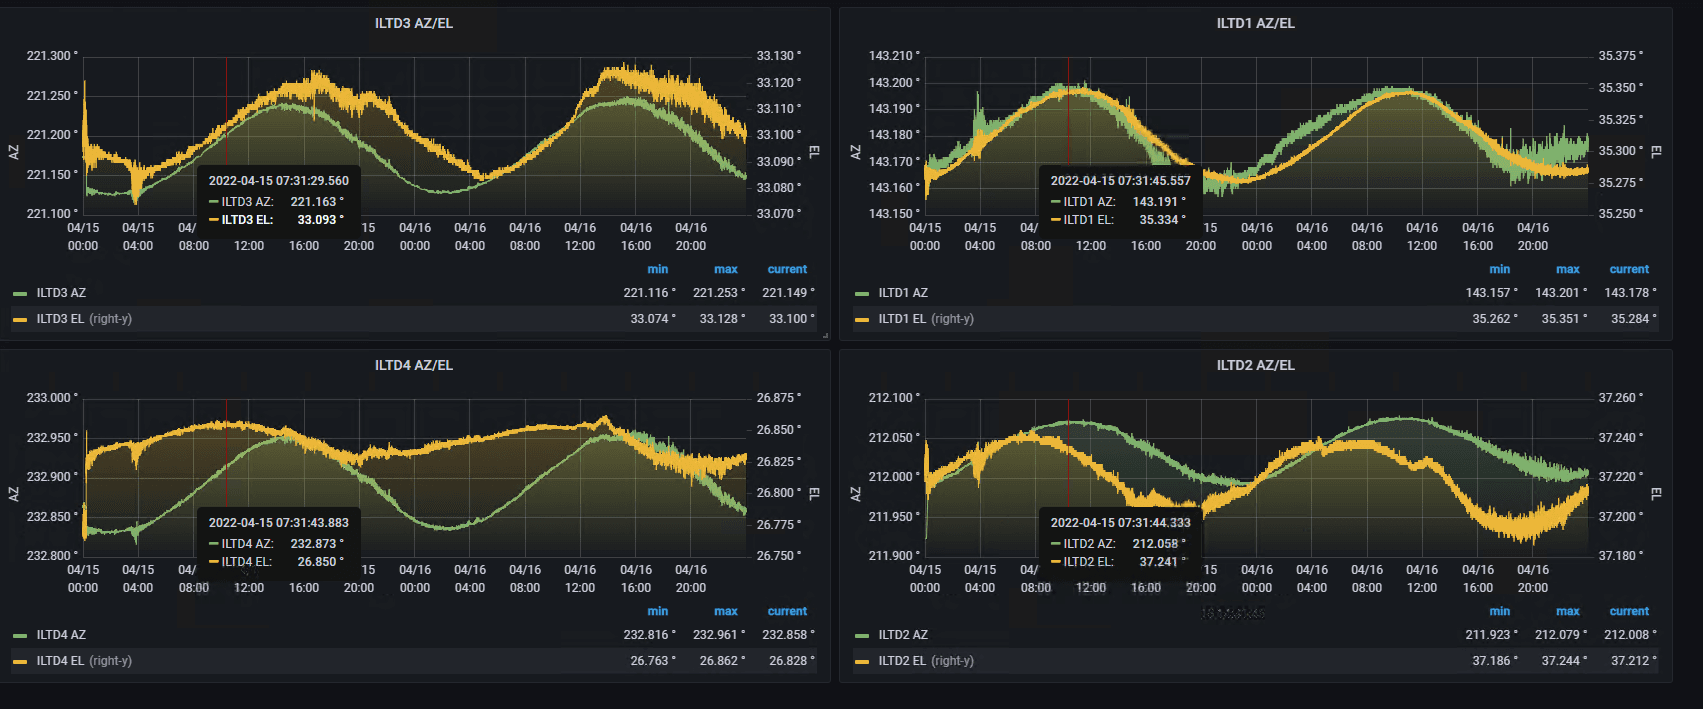
Using Grafana and machine learning to analyze microscopy images: Inside Theia Scientific’s workGrafanaIoT
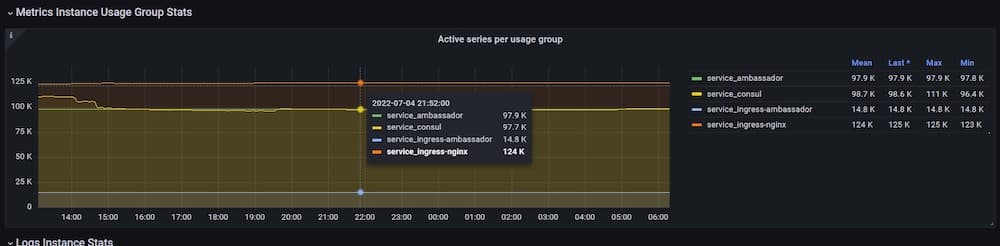
Grafana usage insights: How to track who is sending what metrics to your stack in Grafana CloudGrafanaGrafana Cloud
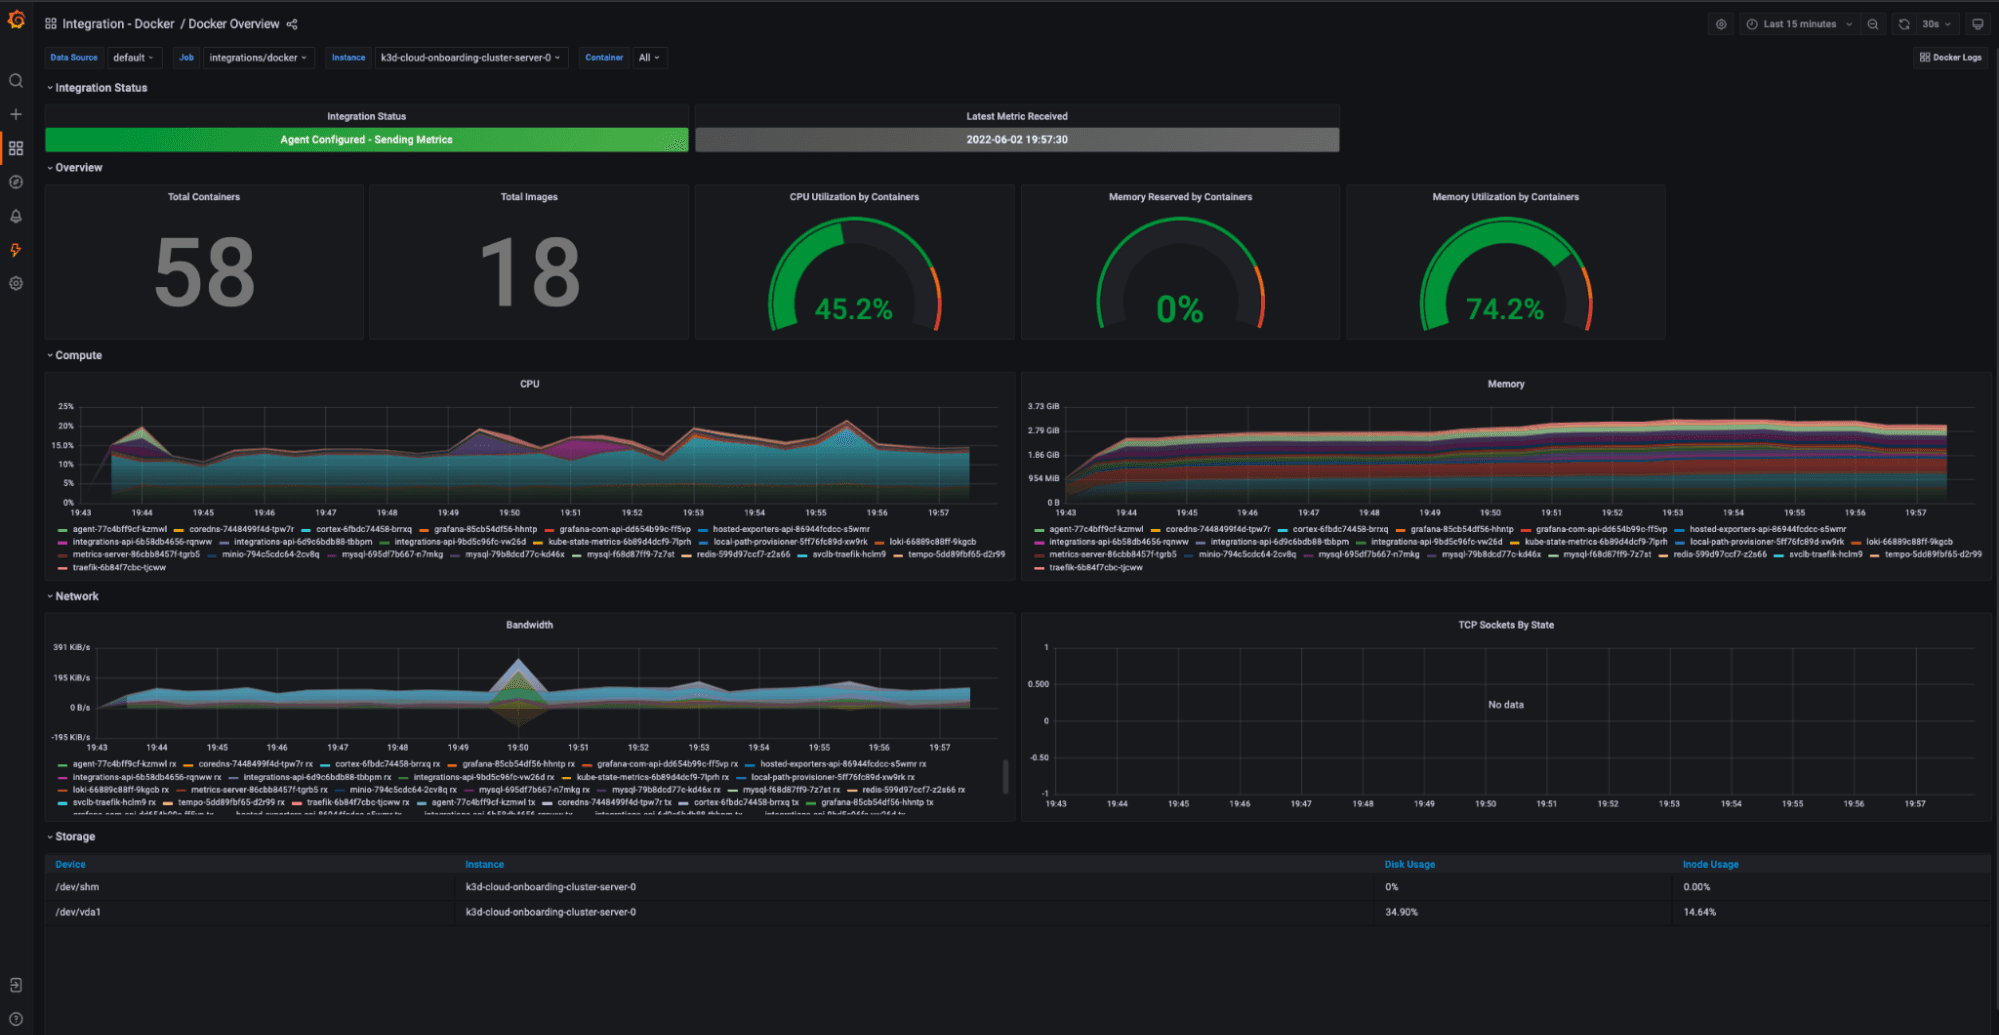
The updated Docker integration in Grafana Cloud now supports logs and metricsIntegrationsGrafana Cloud
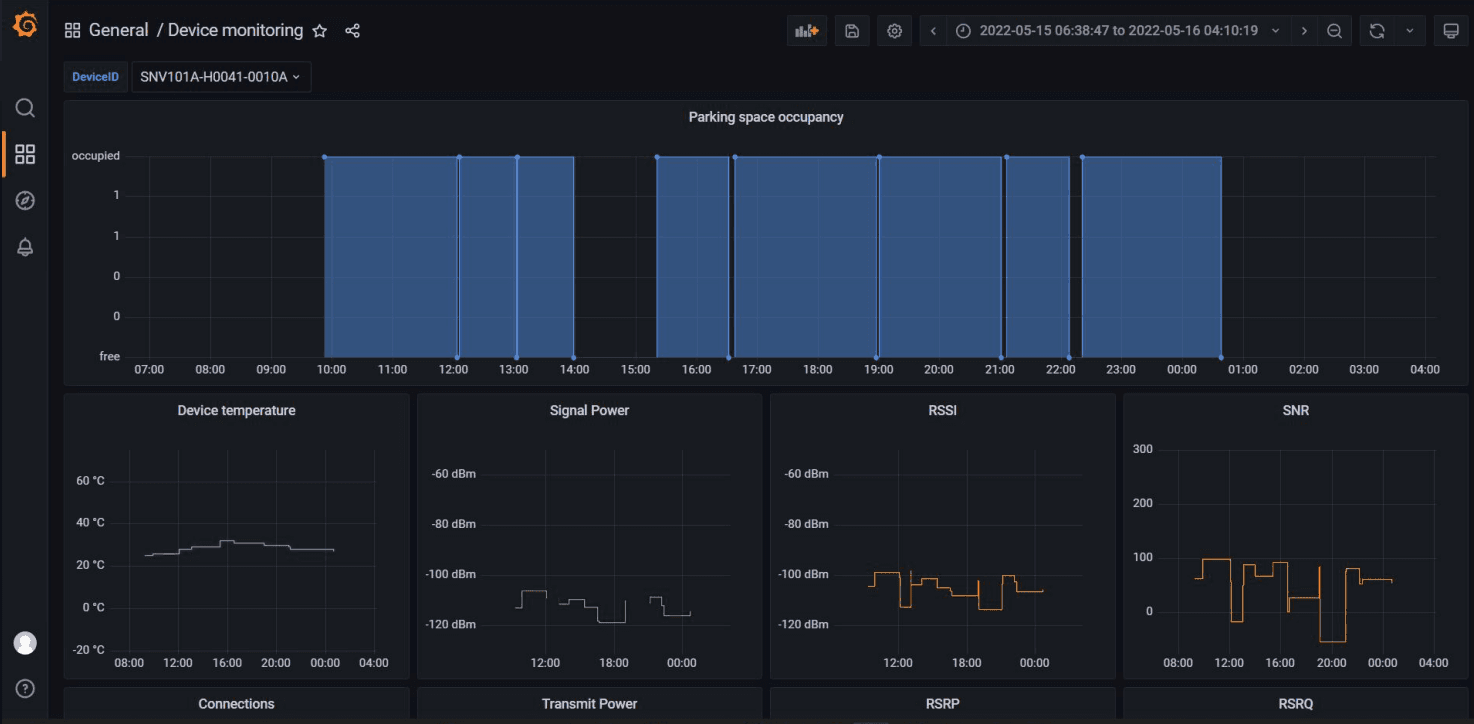
Monitoring smart city IoT devices with Grafana and Grafana Loki: Inside the Fuelics observability stackGrafanaCon
New in Grafana Loki 2.6: multi-tenant queries and targeted log line deletionLokiLoggingGrafana Enterprise Logs
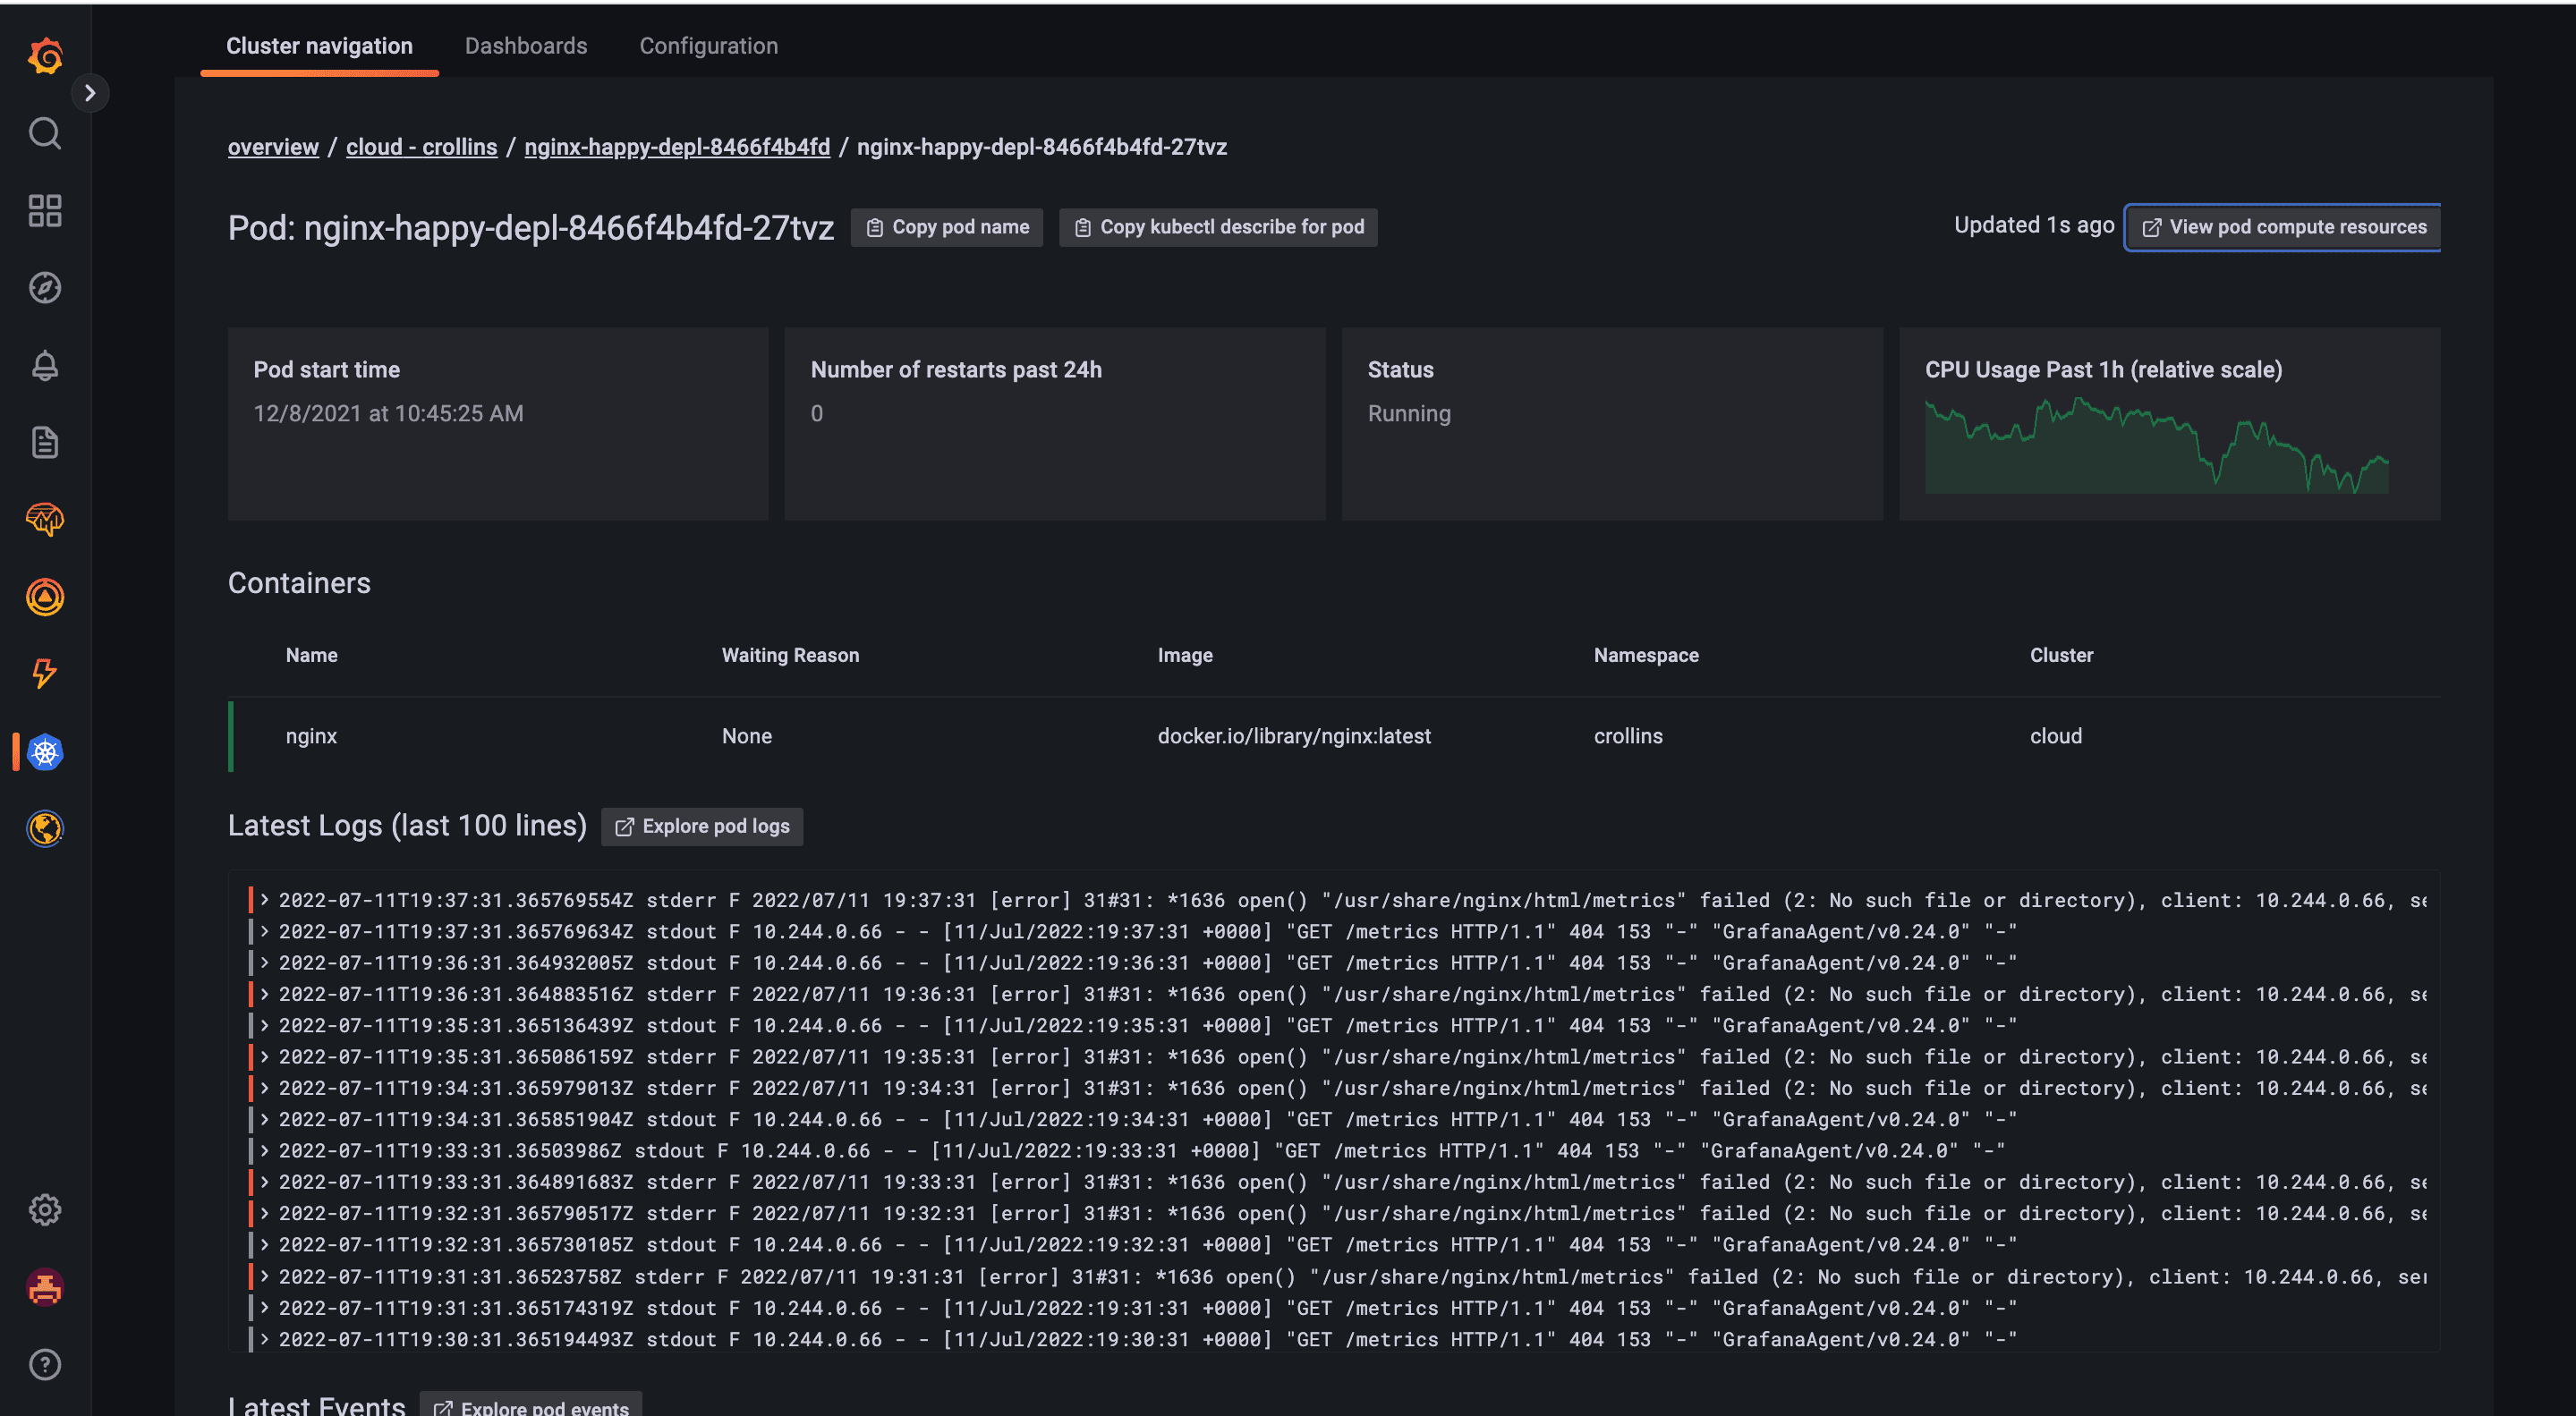
Introducing instant Kubernetes logging with Kubernetes Monitoring in Grafana CloudKubernetesGrafana Cloud
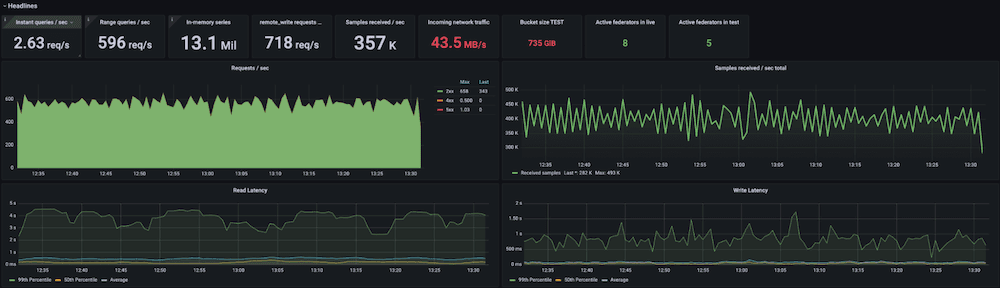
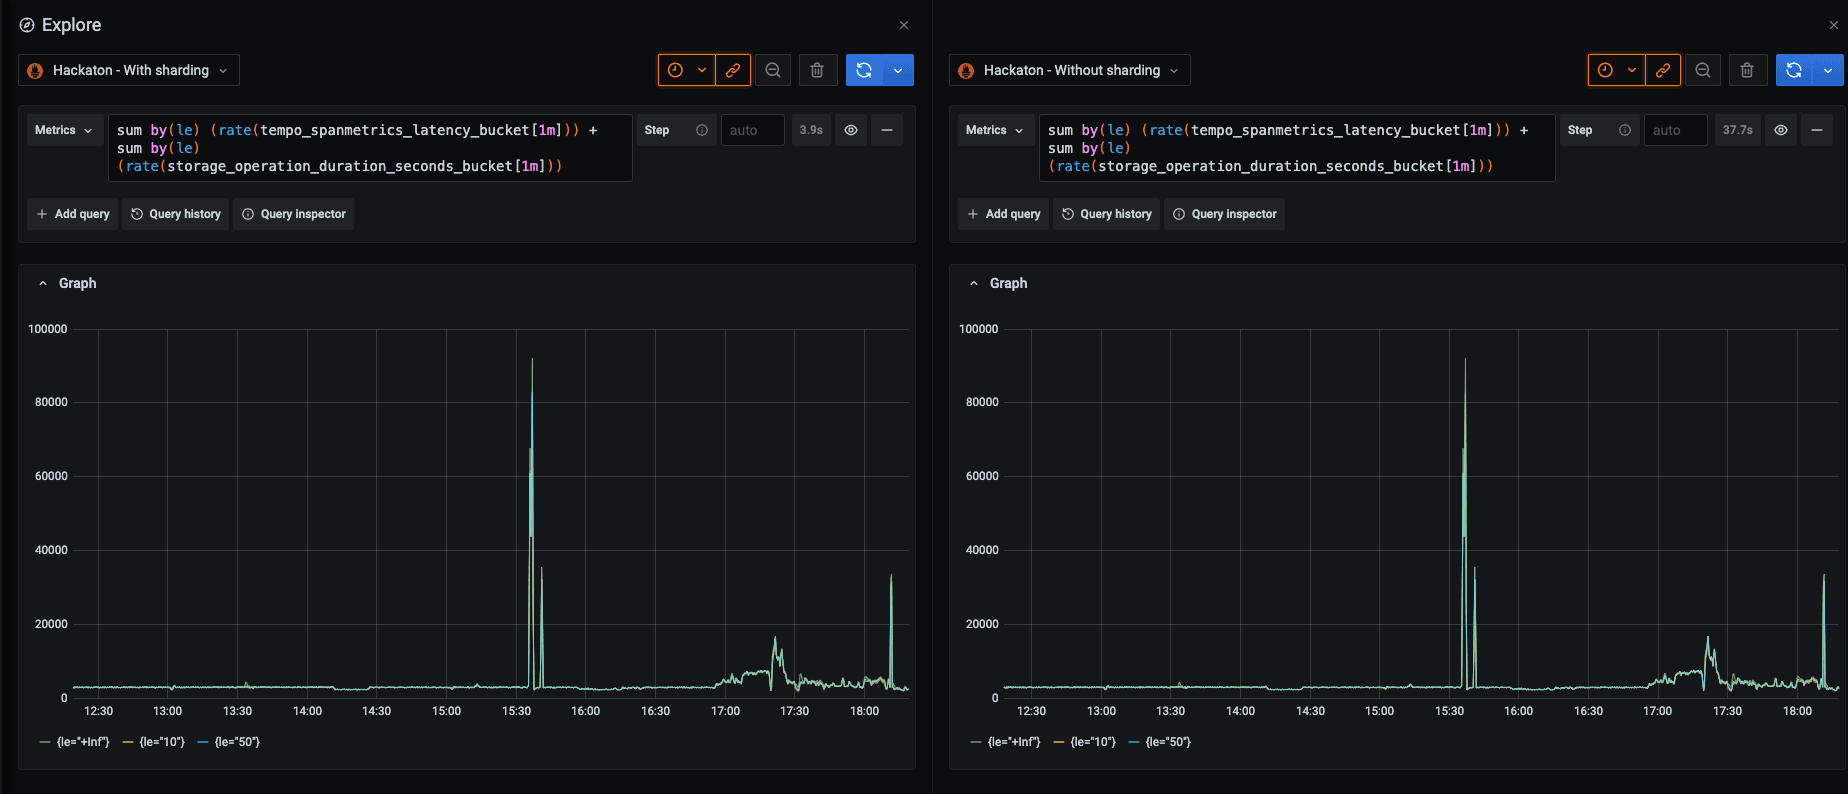
New in Grafana Mimir: Ingest Graphite, Datadog, Influx, and Prometheus metrics into a single storage backendMimir
How to improve uptime with real-time monitoring, Grafana dashboards, and Grafana Loki: Inside Dish Network’s observability stackEvents