2026 observability trends and predictions from Grafana Labs: unified, intelligent, and openAIAdaptive TelemetryOpenTelemetrySLOs
2026 observability trends and predictions from Grafana Labs: unified, intelligent, and openFind out which trends will shape observability in 2026, based on insights from 150 IT decision-makers and the engineers building Grafana Cloud.AIAdaptive TelemetryOpenTelemetrySLOs
Grafana 12.3 release: Interactive learning experiences, new and improved logs visualizations, and moreReleaseGrafana
Grafana Incident for incident management is now generally available in Grafana CloudGrafana CloudGrafana Incident
Building Grafana dashboards for a large-scale deployment in a tight timeline: Inside Cisco LiveGrafanaCon
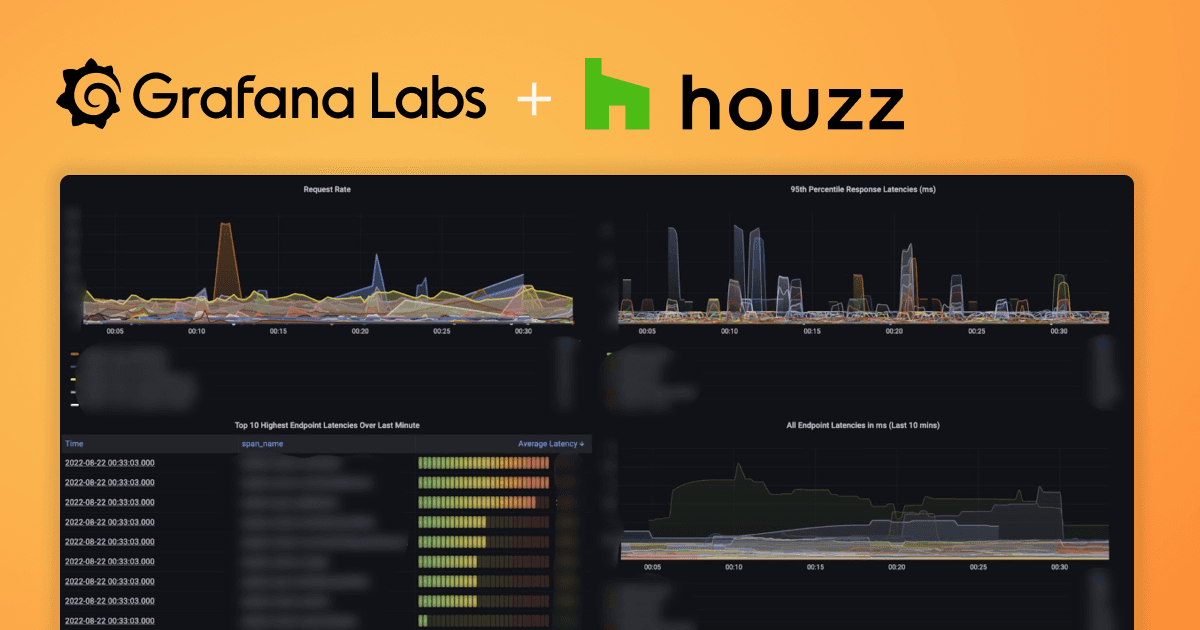
How to reduce MTTR with Grafana Loki and Grafana Tempo: Inside the Houzz observability renovationGrafanaCon
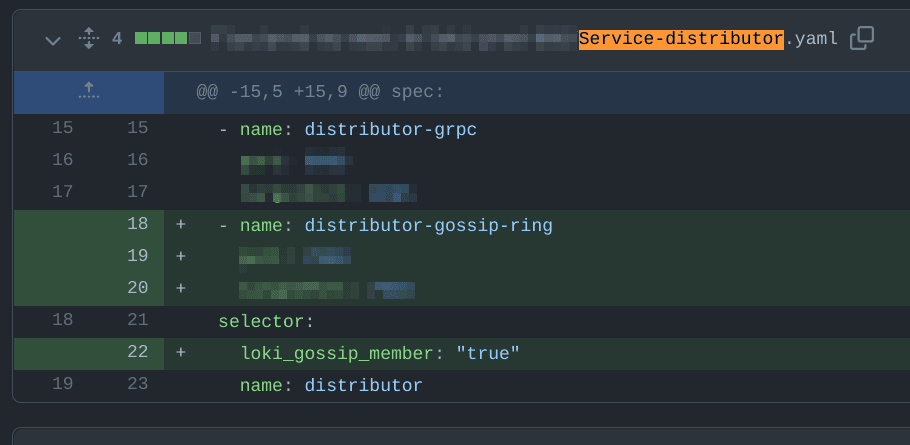
How adding Kubernetes label selectors caused an outage in Grafana Cloud Logs — and how we resolved itGrafana Cloud
Security release: New versions of Grafana and Grafana Image Renderer with a high severity security fix for CVE-2022-31176Security
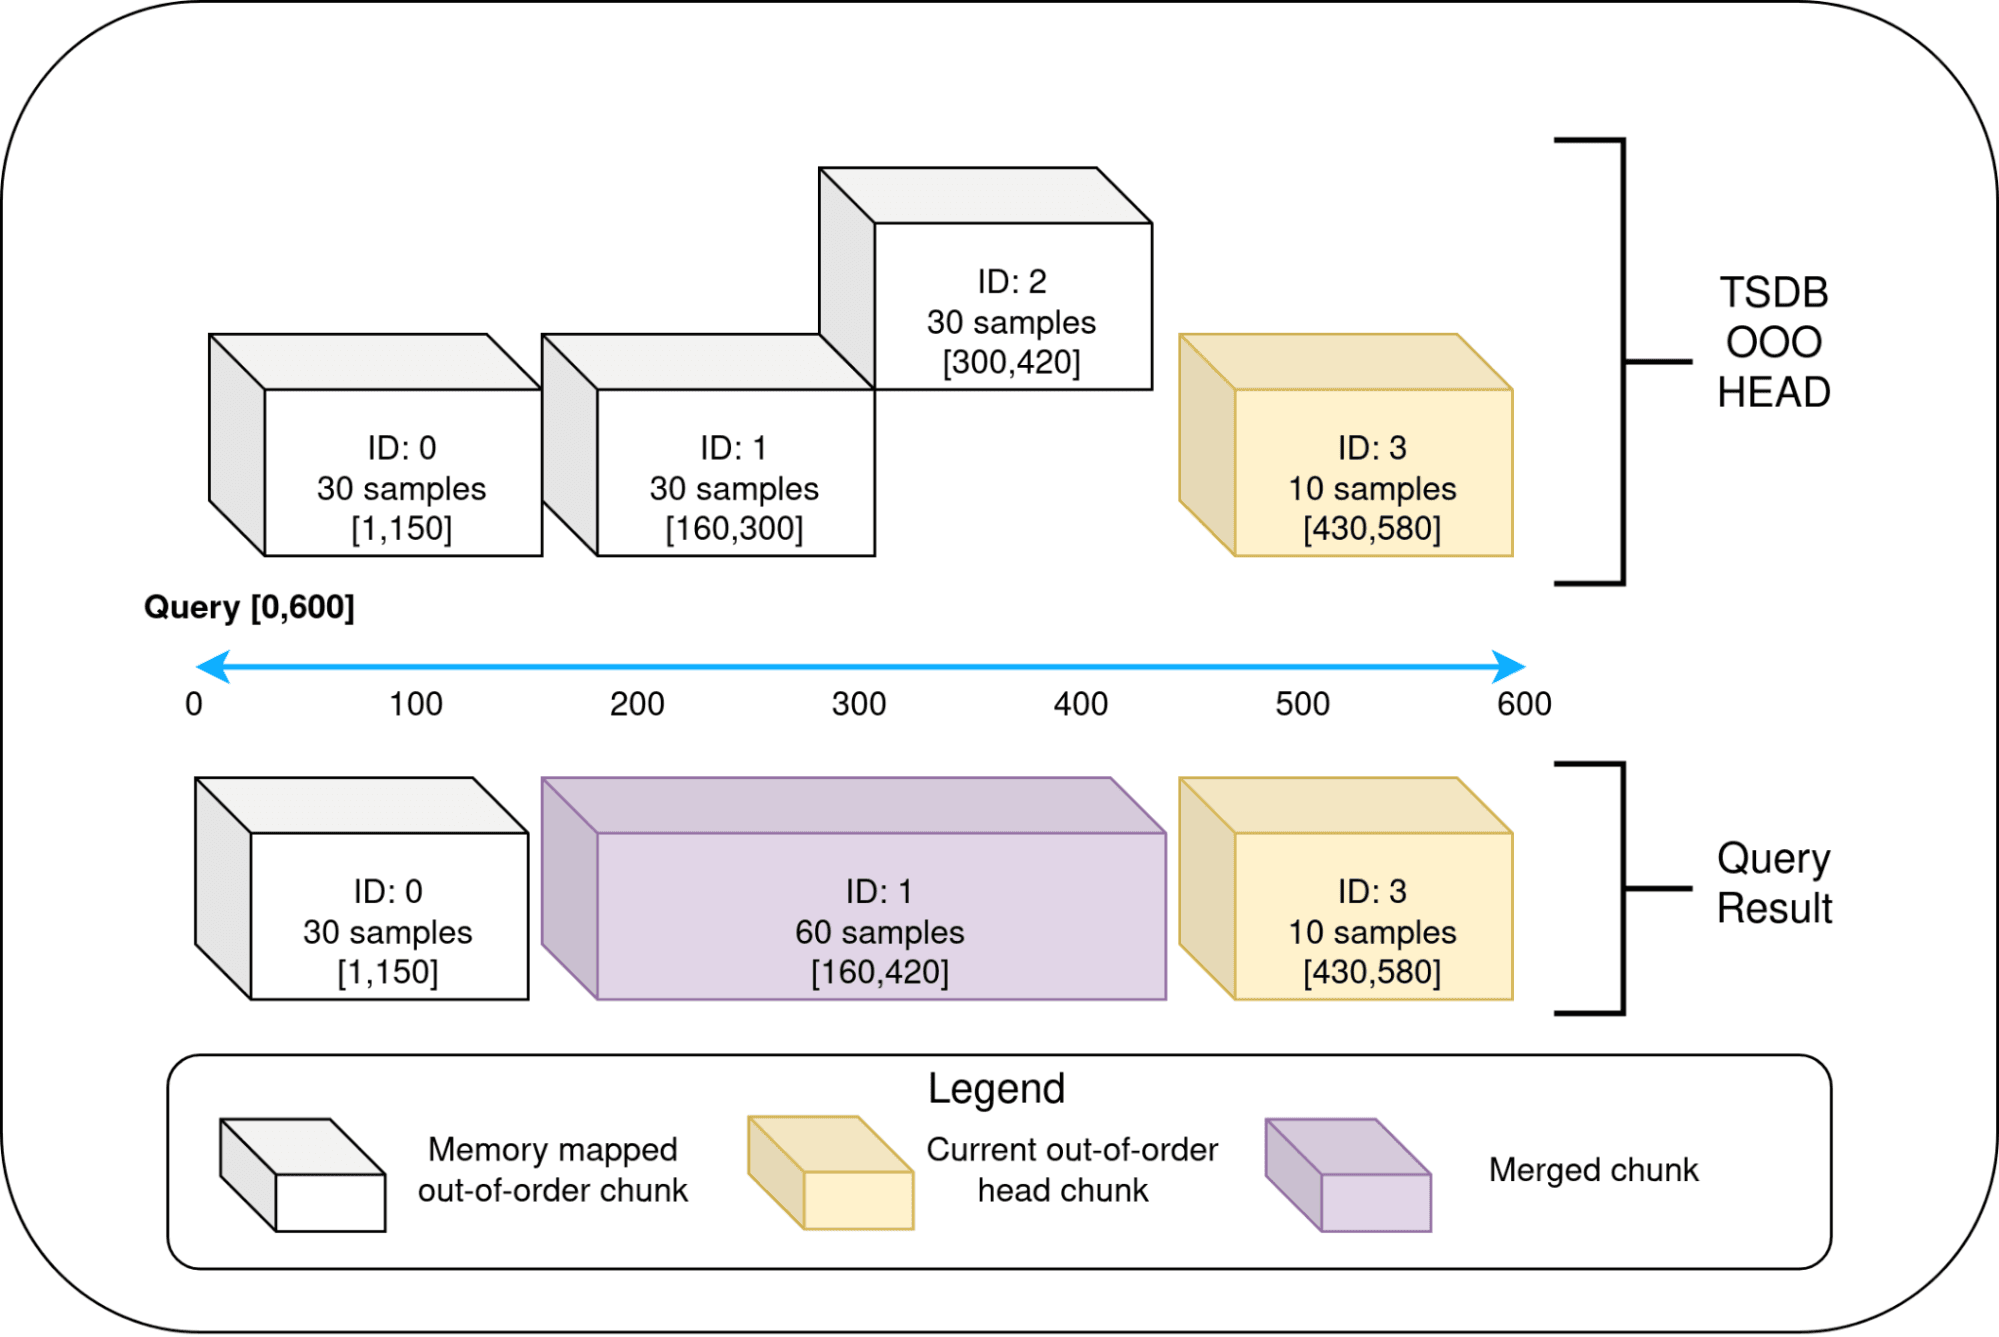
Grafana Tempo 1.5 release: New metrics features with OpenTelemetry, Parquet support, and the path to 2.0Tempo
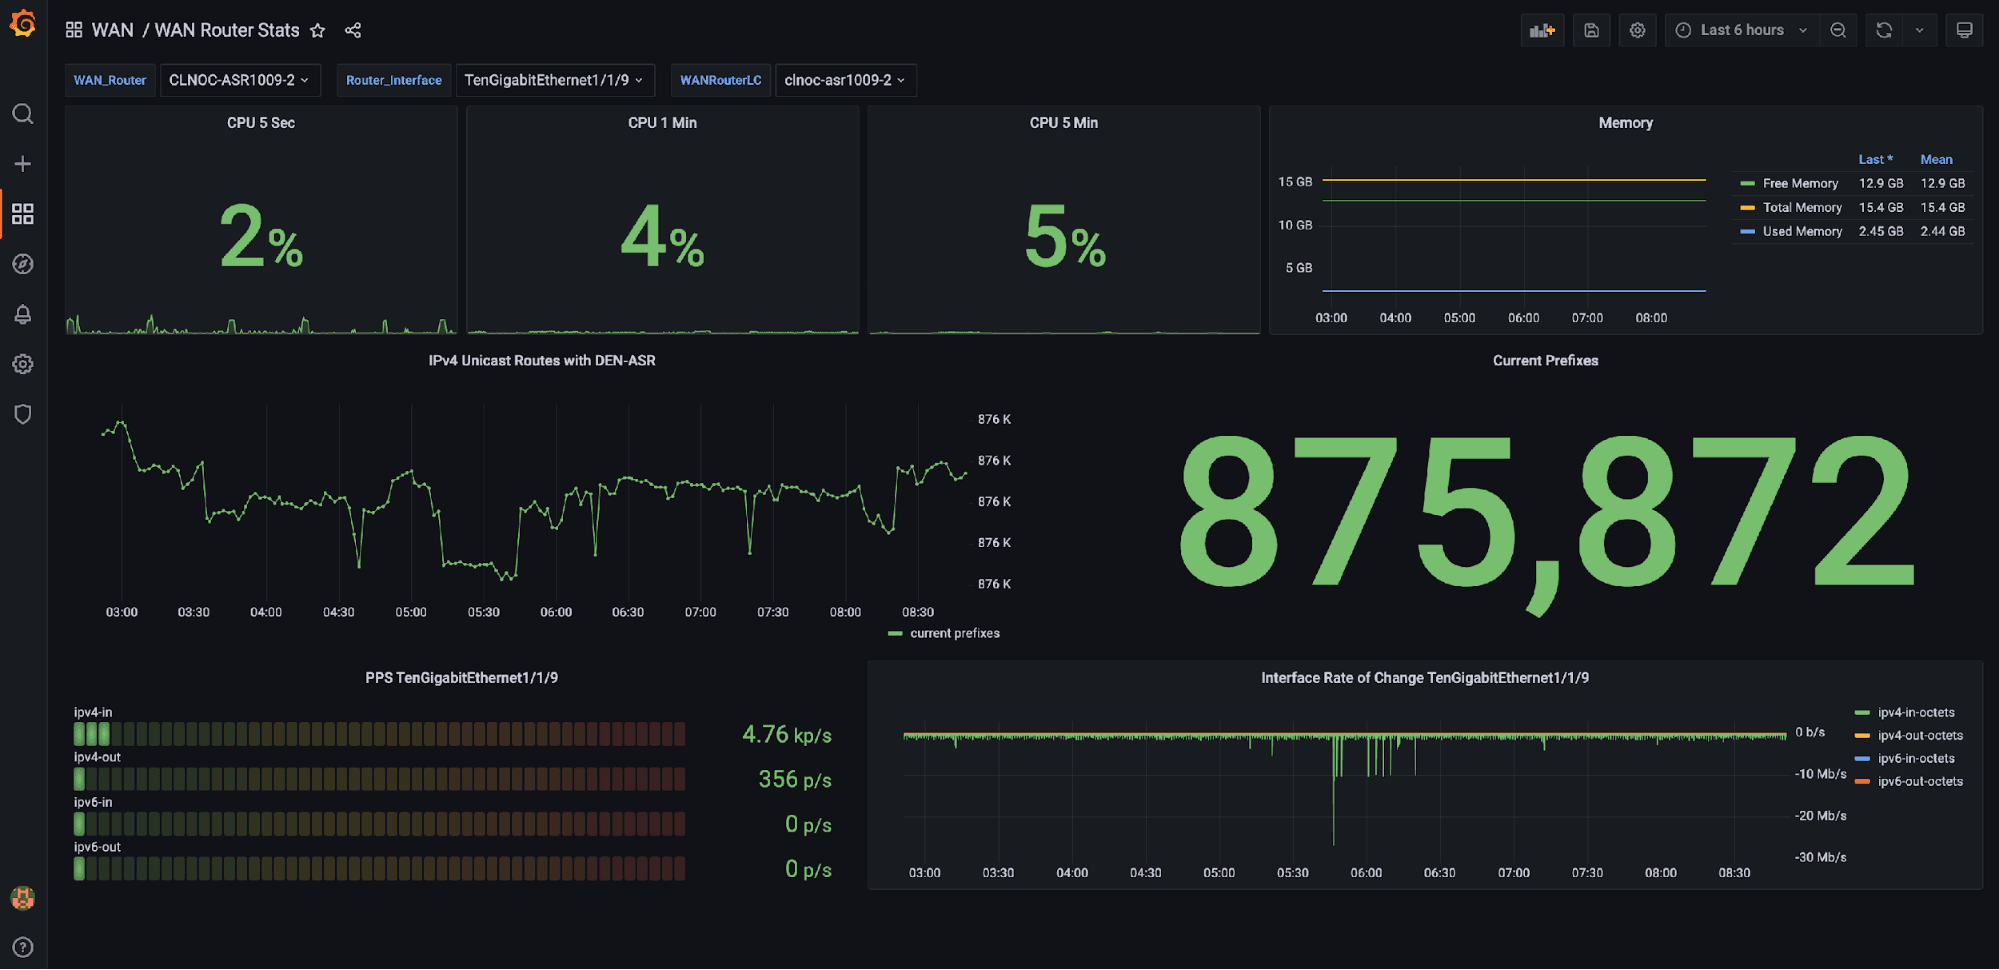
How Denmark’s Energinet uses Grafana Enterprise to monitor underwater energy cables — and do detective workGrafana EnterpriseGrafana
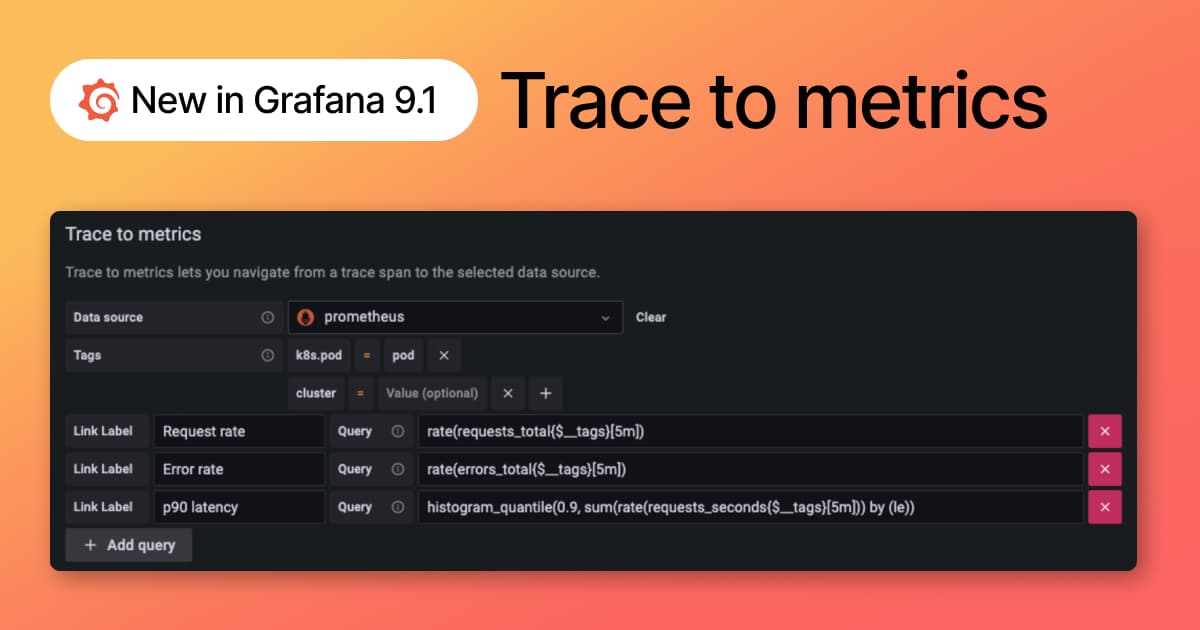
New in Grafana 9.1: Trace to metrics allows users to navigate from a trace span to a selected data sourceGrafanaTempo