Instrumentation Hub: a guided, scalable way to roll out observability coverage without losing controlGrafana AlloyGrafana CloudKubernetes MonitoringApplication observabilityeBPFOpenTelemetry
Grafana Labs: Top 10 moments of 2025From the launch of Grafana Assistant to the first-ever GrafanaCON Science Fair, there were a lot of big moments for Grafana Labs and our open source community in 2025. Here are some of the highlights.Company news
Grafana 12.3 release: Interactive learning experiences, new and improved logs visualizations, and moreReleaseGrafana
Instrumentation Hub: a guided, scalable way to roll out observability coverage without losing controlGrafana AlloyGrafana CloudKubernetes MonitoringApplication observabilityeBPFOpenTelemetry
How to monitor Amazon Bedrock AgentCore AI agent infrastructure in Grafana CloudAWSCloud Provider ObservabilityIntegrations
Monitor Temporal Workflows seamlessly: Introducing the Temporal Cloud integration for Grafana CloudIntegrationsGrafana Cloud
Grafana 12.3 release: Interactive learning experiences, new and improved logs visualizations, and moreReleaseGrafana
Azure Monitor offers Grafana dashboards natively for immediate, real-time operational monitoringDashboardGrafana
A Star Wars dashboard deep dive: How to build your next visualization in less than 12 parsecsDashboard
Continuous profiling for native code: Understanding the what, why, and howContinuous profilingGrafana Cloud Profiles
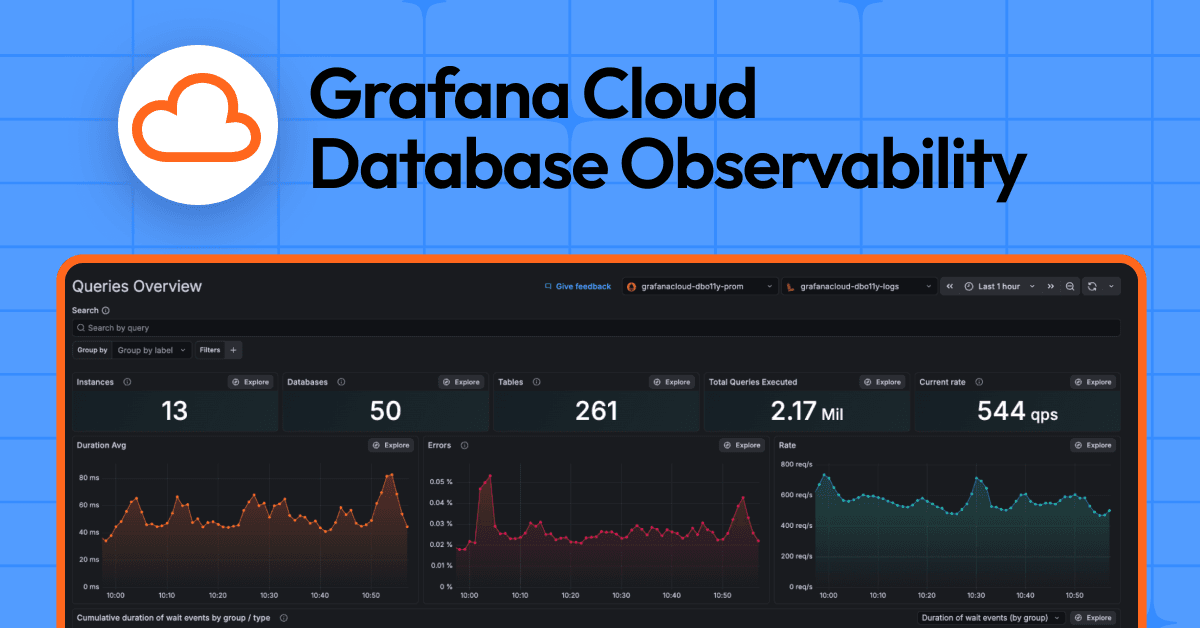
Understand, diagnose, and optimize SQL queries: Introducing Grafana Cloud Database ObservabilityInfrastructure observabilityGrafana Cloud
Performance testing best practices: How to prepare for peak demand with Grafana Cloud k6k6Grafana Cloud k6Performance Testing
Hacking for better observability at scale: How Geotab quickly improved their monitoring with GrafanaHackathon
Prometheus native histograms in Grafana Cloud: Get more precision from your Grafana visualizations Grafana CloudPrometheusMimir