2026 observability trends and predictions from Grafana Labs: unified, intelligent, and openAIAdaptive TelemetryOpenTelemetrySLOs
Mimir’s next-gen architecture—Kafka in the middle, object storage underneath, and a whole lot less couplingPodcastsMimir
What is high cardinality, and is it as scary as people make it out to be?CommunityCost managementAdaptive Telemetry
‘Grafana’s Big Tent’ podcast: Prometheus 3.0, native histograms, and the future of metricsPodcastsPrometheus
Capture high-value traces without managing a pipeline: Tail sampling with Adaptive TracesAdaptive TelemetryTracing
Instrumentation Hub: a guided, scalable way to roll out observability coverage without losing controlGrafana AlloyGrafana CloudKubernetes MonitoringApplication observabilityeBPFOpenTelemetry
ServiceNow and Grafana: How to receive Grafana alert payloads via ServiceNow’s scripted REST API IntegrationsAlerting
Snowflake data visualization: all the latest features to monitor metrics, enhance security, and morePluginsVisualization
Kubernetes observability: How to enrich logs with GeoIP using the Kubernetes Monitoring Helm ChartKubernetes MonitoringGrafana Cloud
How to import Prometheus-style alerts and recording rules to Grafana-managed alerts and recording rulesAlertingPrometheusGrafana
Grafana security release: Medium and high severity security fixes for CVE-2025-4123 and CVE-2025-3580Security
Grafana Cloud updates: New observability as code tools, Grafana Drilldown enhancements, and moreGrafana Cloud
Customize your incident response with new features in Grafana Cloud IRMGrafana Cloud IRMIncident Response & Management
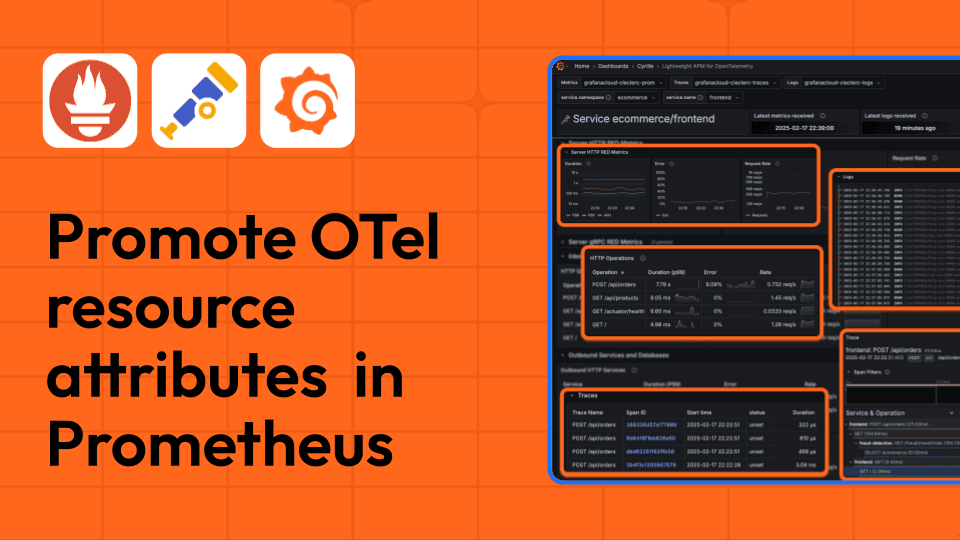
OpenTelemetry with Prometheus: better integration through resource attribute promotionPrometheusOpenTelemetryMimir
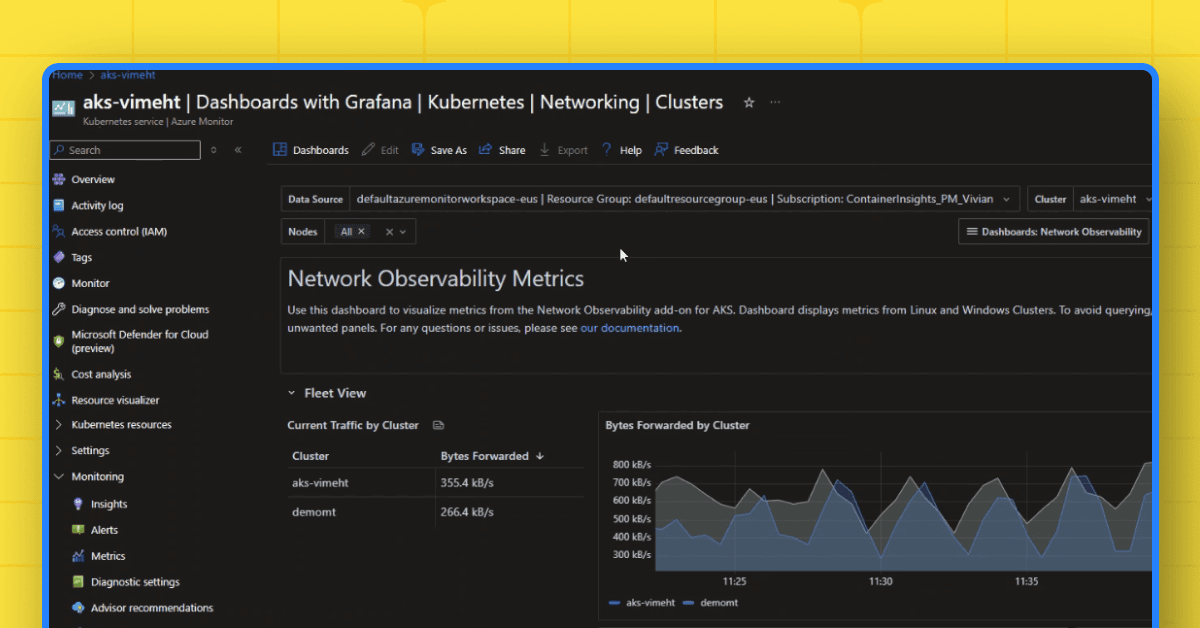
Azure Monitor offers Grafana dashboards natively for immediate real time operational monitoringDashboard
Dashboards and detergent: How two students monitor laundry machines in a college dorm with GrafanaGrafanaVisualizationCommunity
Grafana security update: post-incident review for GitHub workflow vulnerability and what’s nextSecurity
Introducing SCIM provisioning in Grafana: Enterprise-grade user management made simpleGrafanaGrafana EnterpriseGrafana CloudSecurity
Visualize Databricks in Grafana: write custom SQL queries, build interactive dashboards, and morePlugins
Queryless tracing for faster root-cause analysis: Grafana Traces Drilldown is generally availableDrilldownTracing
Grafana Alloy at 1: What’s new and what’s next for our OpenTelemetry Collector distributionGrafana Alloy
Kubernetes observability: How to enrich logs with GeoIP using the Kubernetes Monitoring Helm ChartKubernetes MonitoringGrafana Cloud
Grafana Cloud updates: New observability as code tools, Grafana Drilldown enhancements, and moreGrafana Cloud
2026 observability trends and predictions from Grafana Labs: unified, intelligent, and openFind out which trends will shape observability in 2026, based on insights from 150 IT decision-makers and the engineers building Grafana Cloud.AIAdaptive TelemetryOpenTelemetrySLOs
Grafana 12.3 release: Interactive learning experiences, new and improved logs visualizations, and moreReleaseGrafana
2026 observability trends and predictions from Grafana Labs: unified, intelligent, and openAIAdaptive TelemetryOpenTelemetrySLOs
A context-aware LLM agent built directly into Grafana Cloud: Introducing Grafana AssistantAIGrafana Cloud