Distributed performance testing for Kubernetes environments: Grafana k6 Operator 1.0 is herek6Performance TestingKubernetesLoad testing
Kubernetes Monitoring backend 2.2: better cluster observability through new alert and recording rulesKubernetes MonitoringKubernetes
Demystifying the OpenTelemetry Operator: Observing Kubernetes applications without writing codeOpenTelemetryKubernetesApplication observability
Creating alerts from panels in Kubernetes Monitoring: an overlooked, powerhouse featureKubernetes MonitoringKubernetesAlerting
Observe deleted Kubernetes components in Grafana Cloud to boost troubleshooting and resource managementKubernetes MonitoringKubernetesGrafana CloudIncident Response & Management
Grafana Labs at KubeCon: eBPF, sustainability, Prometheus, and moreKubeConKuberneteseBPFPrometheusEventsSustainability
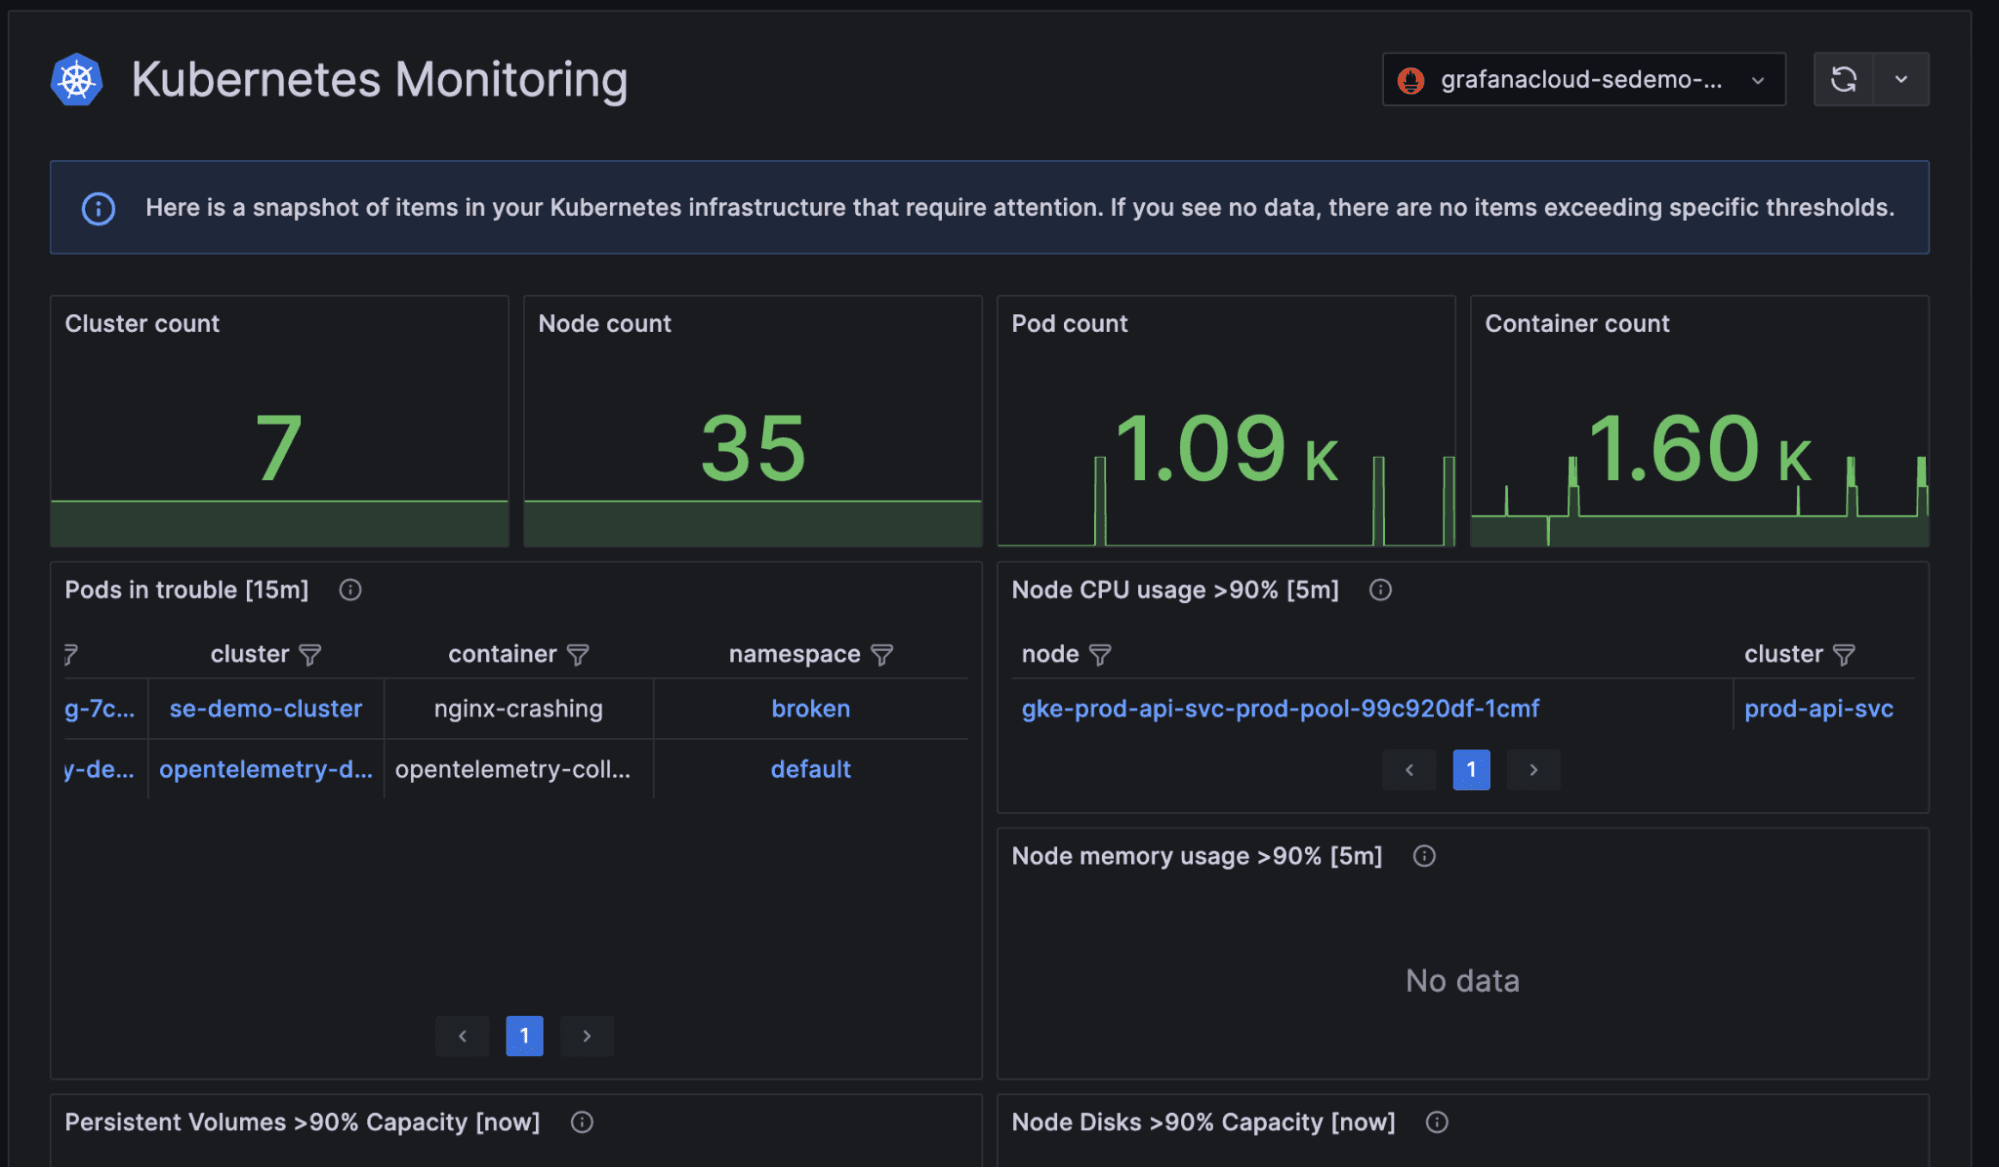
Kubernetes alerting: Simplify anomaly detection in Kubernetes clusters with Grafana CloudKubernetes MonitoringKubernetesAlerting
The case for Kubernetes resource limits: predictability vs. efficiencyKubernetesKubernetes Monitoring
New in Kubernetes Monitoring: cost management, resource usage monitoring, and moreKubernetesKubernetes MonitoringGrafana Cloud
Kubernetes cost optimization: tips for a more efficient operationKubernetes MonitoringKubernetesGrafana Cloud
Simplify managing Grafana Tempo instances in Kubernetes with the Tempo OperatorTempoKubernetesCommunity
Monitor the past, present, and future of your Kubernetes resource utilizationKubernetes MonitoringKubernetes
Grafana Agent v0.33 release: reusable pipelines, monitoring Kubernetes pods, and moreGrafana AgentKubernetes
KubeCon + CloudNativeCon EU 2023 preview: Prometheus, OpenTelemetry, load testing, and more!Kubernetes
How to migrate existing Grafana dashboards and alerts into Kubernetes Monitoring in Grafana CloudKubernetesGrafana CloudAlertingDashboard