Instrumentation Hub: a guided, scalable way to roll out observability coverage without losing controlGrafana AlloyGrafana CloudKubernetes MonitoringApplication observabilityeBPFOpenTelemetry
What's new in the Grafana Image Renderer: higher-quality results, security enhancements, and moreGrafanaGrafana CloudDashboard
Grafana Labs: Top 10 moments of 2025From the launch of Grafana Assistant to the first-ever GrafanaCON Science Fair, there were a lot of big moments for Grafana Labs and our open source community in 2025. Here are some of the highlights.Company news
Grafana 12.3 release: Interactive learning experiences, new and improved logs visualizations, and moreReleaseGrafana
Improve service reliability and ops culture with Grafana Cloud Service Center AlertingSLOsGrafana CloudGrafana Cloud IRM
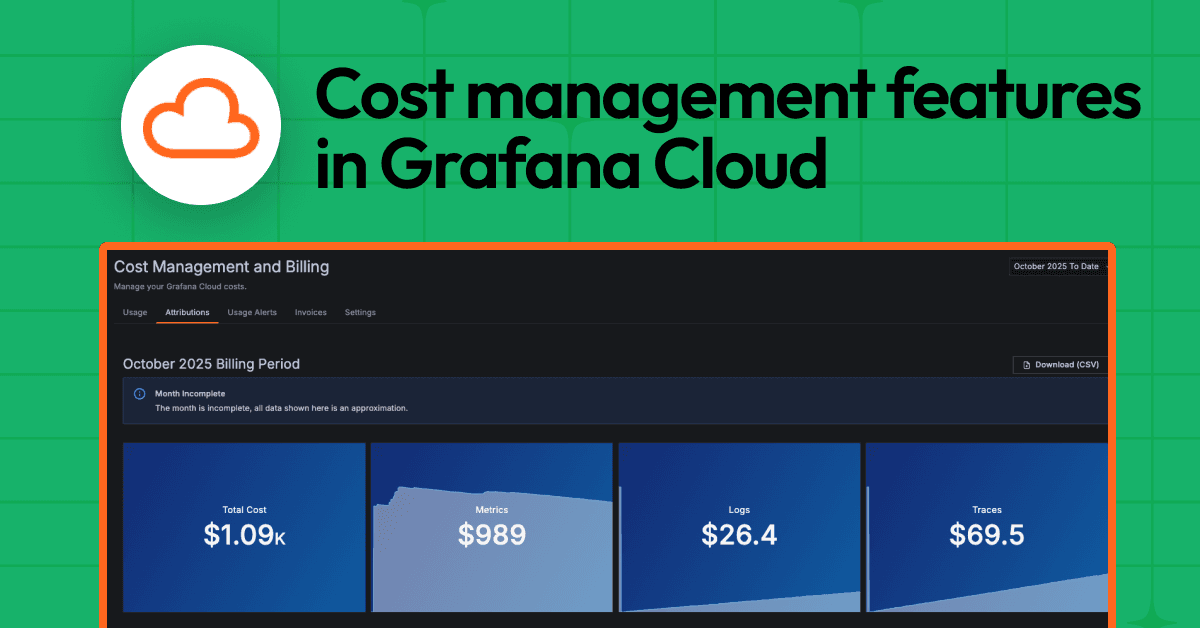
Managing observability costs at scale: A look at the latest cost management features in Grafana Cloud Grafana CloudCost management
Maximize data value and cut costs: Adaptive Telemetry for metrics, logs, traces, and profiles in Grafana CloudGrafana CloudCost managementAdaptive Telemetry
The observability maturity curve: How IT leaders are shifting from tools to outcomesGrafana CloudSLOsAI
Grafana Labs Co-founder Woods: Market maturity, OpenTelemetry, and AI are reshaping observabilityOpenTelemetryAI
Lighting up your dashboards: How to visualize the CheerLights IoT project in Grafana CloudGrafana CloudIoTDashboard
Grafana 12.2 release: LLM-powered SQL expressions, updates to canvas and table visualizations, simplified reporting, and moreGrafana
Single-tenant vs. multi-tenant architecture with Grafana Cloud: A guide to choosing the right approachSecurity
Distributed performance testing for Kubernetes environments: Grafana k6 Operator 1.0 is herek6Performance TestingKubernetesLoad testing
Data storytelling at HackUPC 2025: Celebrating 3 student hackathon projects powered by GrafanaGrafana