What's new in the Grafana Image Renderer: higher-quality results, security enhancements, and moreGrafanaGrafana CloudDashboard
Contextual, in-product guidance for every Grafana user: A closer look at Interactive LearningGrafanaGrafana Cloud
How to monitor AI agent applications on Amazon Bedrock AgentCore with Grafana CloudAWSIntegrationsAI/ML
Baking in site reliability with observability and AI: How SpotOn uses Grafana Assistant to keep restaurants runningAI/ML
Grafana Labs: Top 10 moments of 2025From the launch of Grafana Assistant to the first-ever GrafanaCON Science Fair, there were a lot of big moments for Grafana Labs and our open source community in 2025. Here are some of the highlights.Company news
Grafana 12.3 release: Interactive learning experiences, new and improved logs visualizations, and moreReleaseGrafana
Improve service reliability and ops culture with Grafana Cloud Service Center AlertingSLOsGrafana CloudGrafana Cloud IRM
ServiceNow and Grafana: How to receive Grafana alert payloads via ServiceNow’s scripted REST API IntegrationsAlerting
A Star Wars dashboard deep dive: How to build your next visualization in less than 12 parsecsDashboard
Continuous profiling for native code: Understanding the what, why, and howContinuous profilingGrafana Cloud Profiles
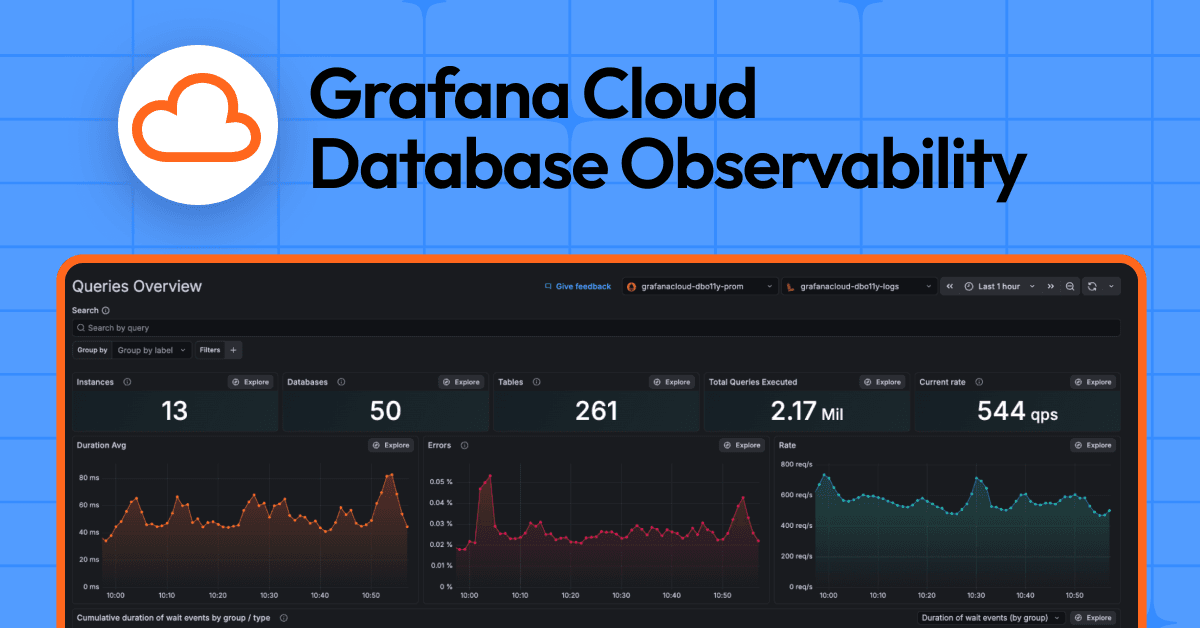
Understand, diagnose, and optimize SQL queries: Introducing Grafana Cloud Database ObservabilityInfrastructure observabilityGrafana Cloud
Performance testing best practices: How to prepare for peak demand with Grafana Cloud k6k6Grafana Cloud k6Performance Testing
Hacking for better observability at scale: How Geotab quickly improved their monitoring with GrafanaHackathon
Prometheus native histograms in Grafana Cloud: Get more precision from your Grafana visualizations Grafana CloudPrometheusMimir
Grafana Labs at KubeCon: OpenTelemetry eBPF Instrumentation, Prometheus deep dives, and moreKubeConEvents
Faster, more collaborative data exploration: Introducing saved queries in Grafana CloudGrafana CloudDashboard
Show me the (meeting) money: How to monitor the real-time costs of a meeting in GrafanaGrafanaDashboard
From pillars to rings: How interconnected observability in Grafana Cloud optimizes performance and reduces telemetry wasteGrafana Cloud
Baking in site reliability with observability and AI: How SpotOn uses Grafana Assistant to keep restaurants runningAI/ML
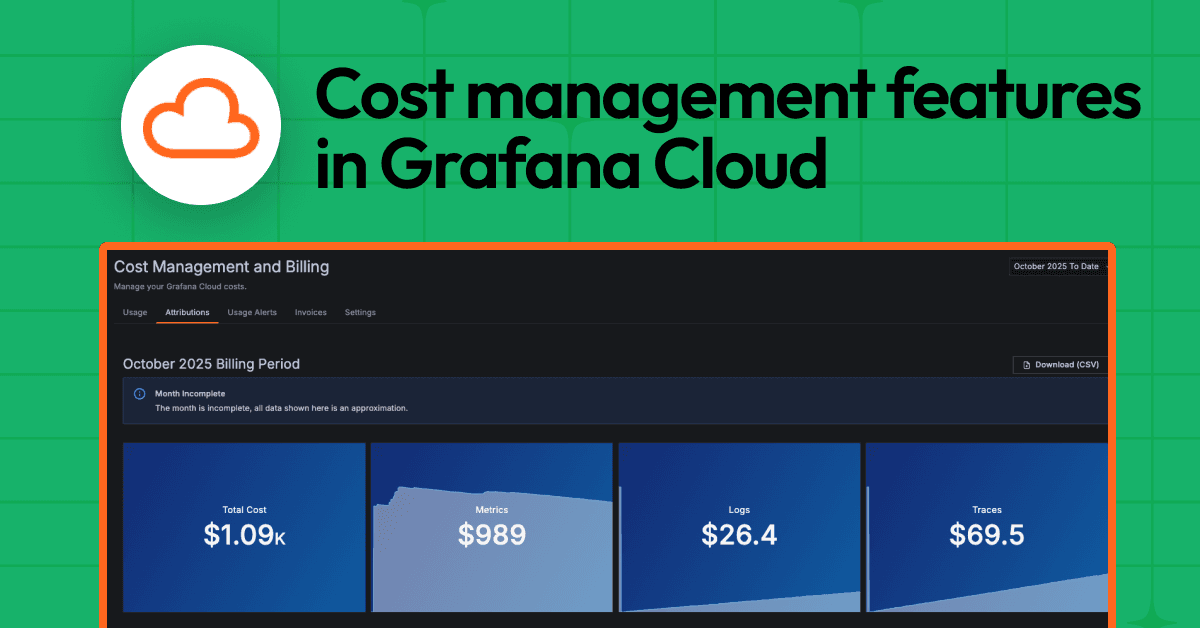
Managing observability costs at scale: A look at the latest cost management features in Grafana Cloud Grafana CloudCost management