
Validator
The Validator can help you debug test scripts. You can use it to run one iteration of your test and visualize, for example, requests, logs, and browser interactions. It supports both HTTP tests and browser tests, and can run any k6 test scripts, including scripts created outside of k6 Studio.
The content of the Validator window depends on the type of test script. The basic layout is:
Test script name
The name of the test script.
Validator actions
On the top-right you can see the action buttons for the Validator. From here you can:
- Click Debug script to run one iteration of your test script.
- Click Run in Grafana Cloud to run your test in Grafana Cloud k6.
- Click the menu icon to:
- Open external script: Open a k6 test script from your computer. After opening it, click Validate script to run one iteration of the test.
- Delete: Deletes the selected test script.
Main view
Below the test script name is the main view of the Validator. From here, you can inspect the opened script and any data generated during a debug session.
Debug panel
This panel contains additional information about the test results, such as the logs emitted during its execution, or console messages for browser tests.
Debug a test
To debug a script:
- Open a script.
- Click Debug script on the top-right.
After you click Debug script, k6 Studio runs one iteration of the test script and shows you the results of the test as the script is executed.
Run a test in Grafana Cloud
After debugging a script, you can execute the same test, but using the load profile and load zones you have configured in the script, to run a performance test and see how your application behaves in a real-world scenario.
k6 Studio includes a built-in integration with Grafana Cloud, that enables you to login and run a test by clicking Run in Grafana Cloud. For more details, refer to Run a test script in Grafana Cloud k6.
Inspect test results
During a debug session, and once it’s completed, you can inspect the test results. The view depends on which type of test was run.
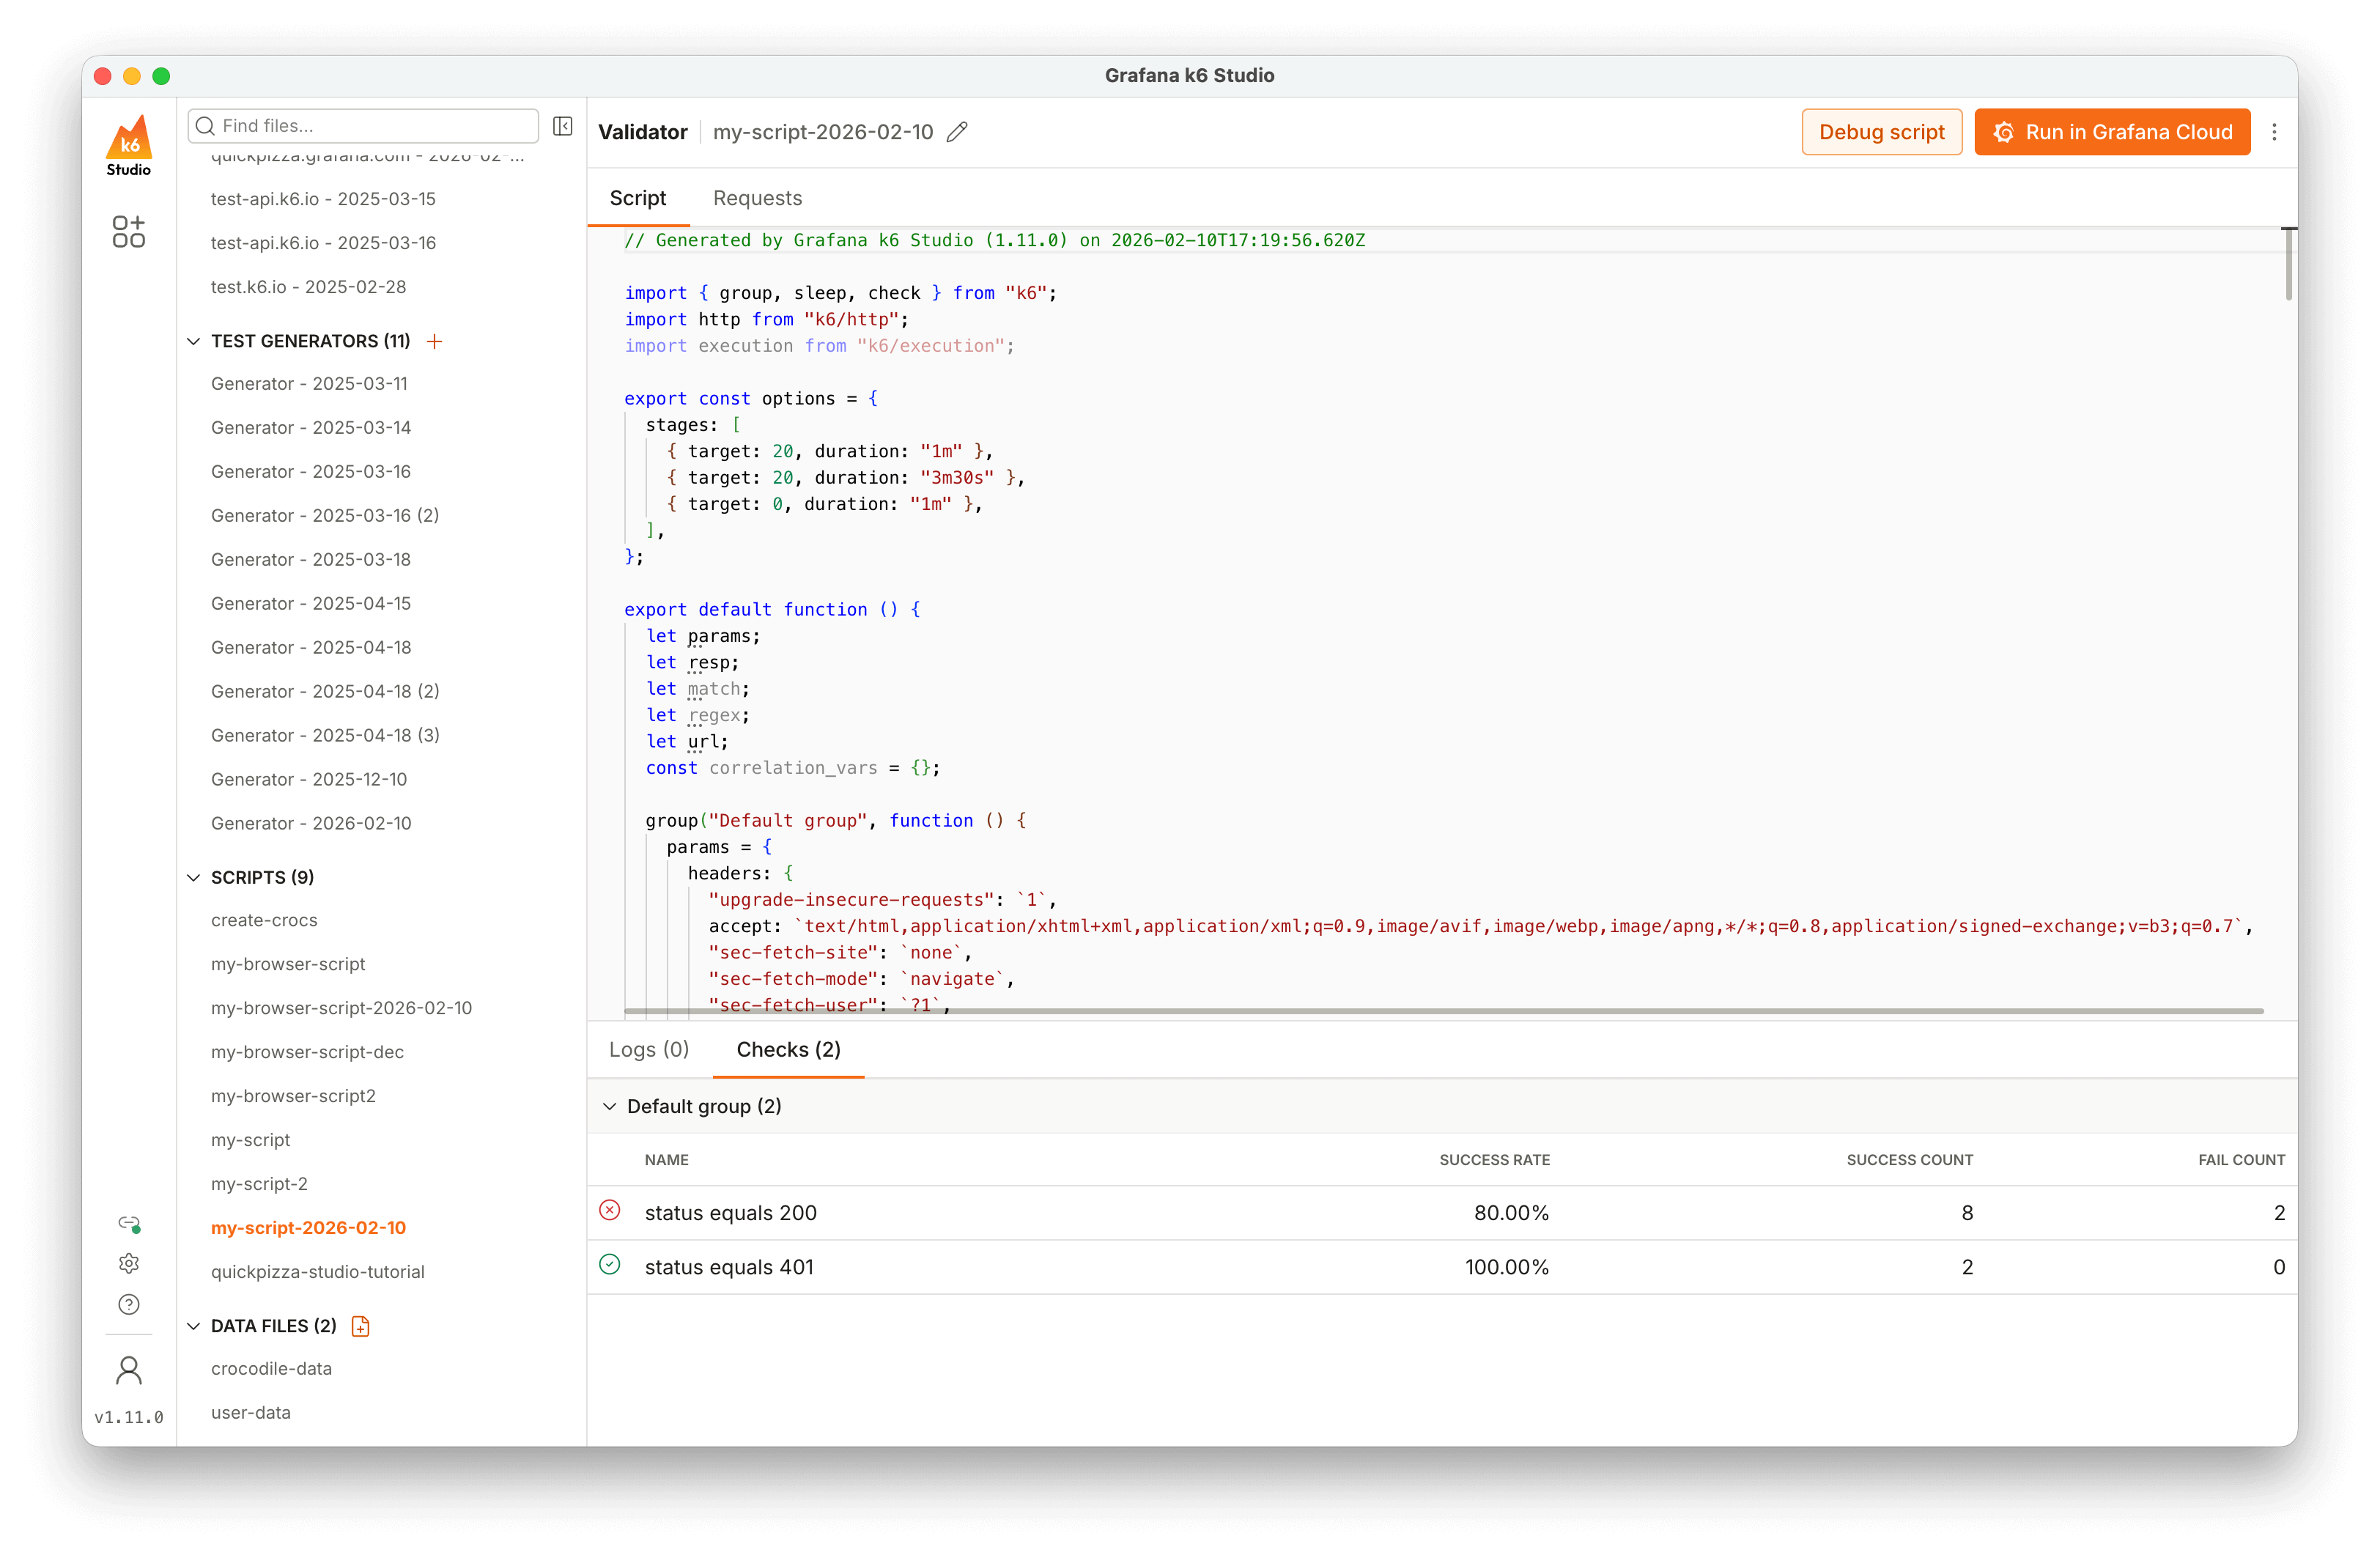
HTTP test
Tabs
From here, you can switch between viewing the executed script and the list of requests made during execution.
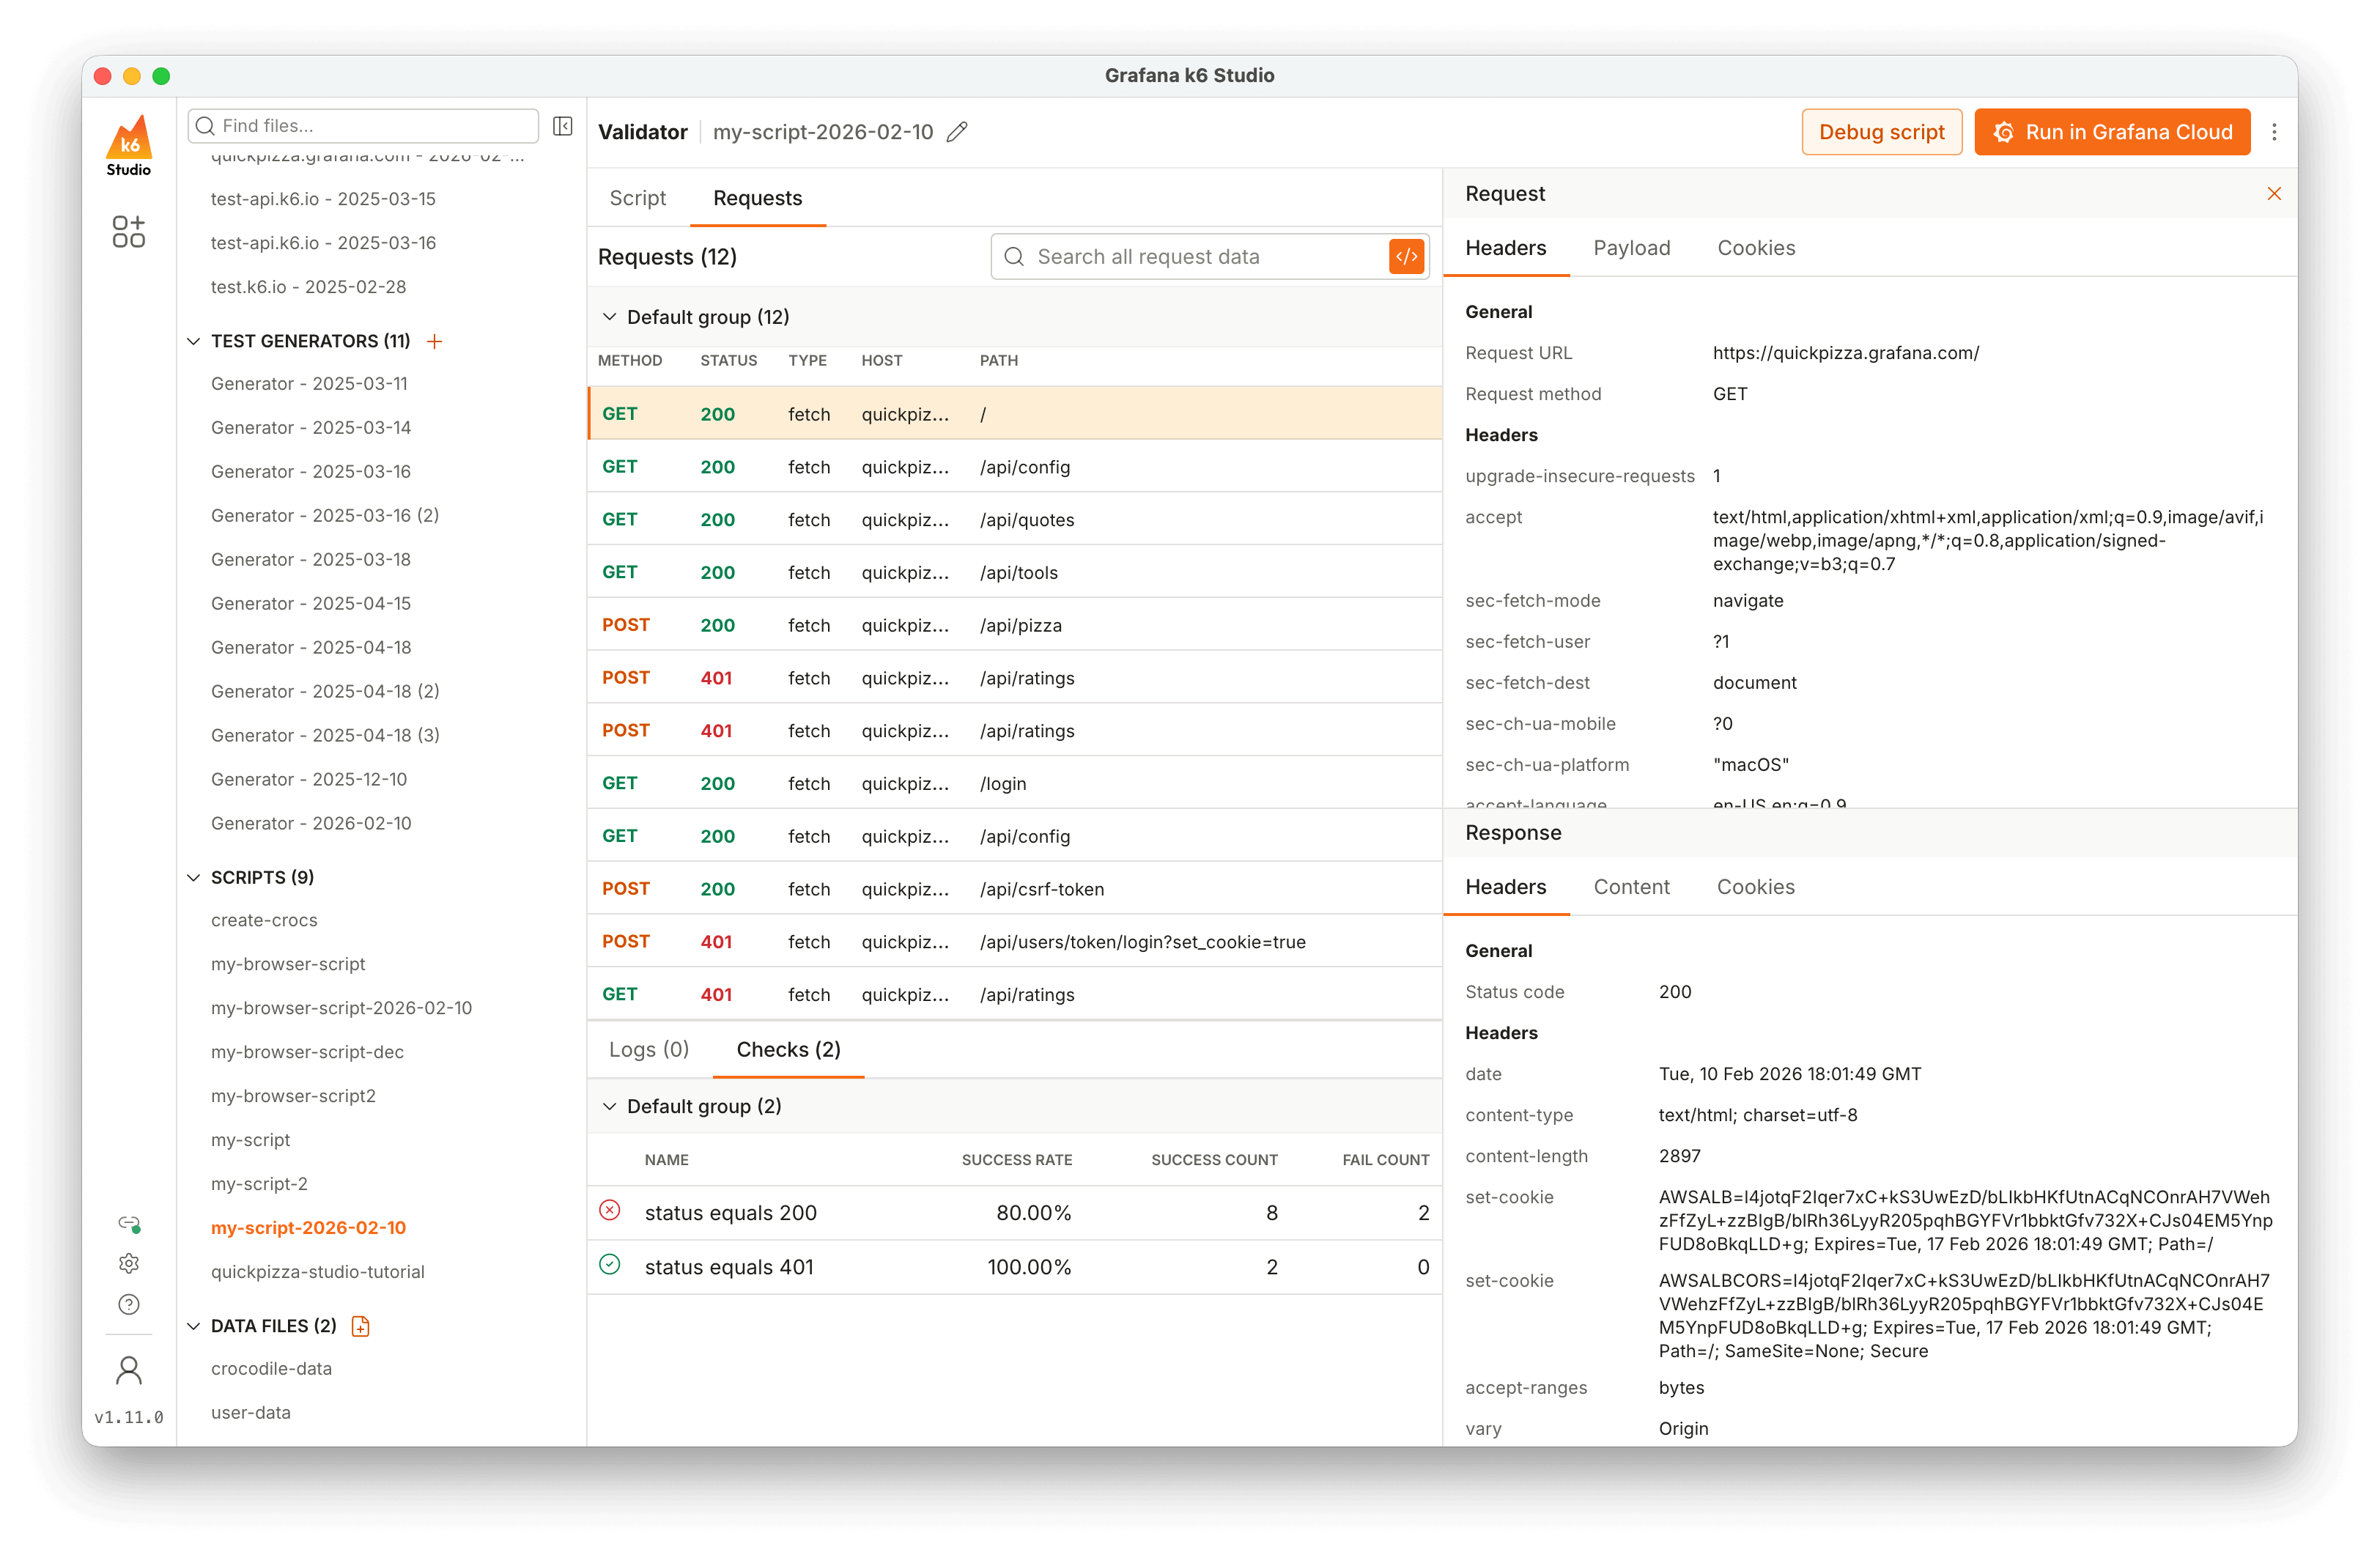
Validator options
Below the tabs, you can see:
- Requests: The total number of requests executed from the test script run.
- Search: A search box that lets you search the list of requests by URL, method (such as GET or POST), and status code. You can also use the toggle to search across all request data.
Requests and groups list
The list of requests, and groups if any, that were executed in the test run. The requests are organized by time, and you can see the method, status code, host, and path for each one. You can also collapse and expand groups to inspect them more easily.
Request and response inspector
When you click on a request from the requests list, a panel opens on the right side which shows the request and response details for that request. You can use it to inspect the headers, payload, cookies, and content of the requests.
Logs and checks
Any logs or checks generated by test run can be found on their respective tabs.
Browser test
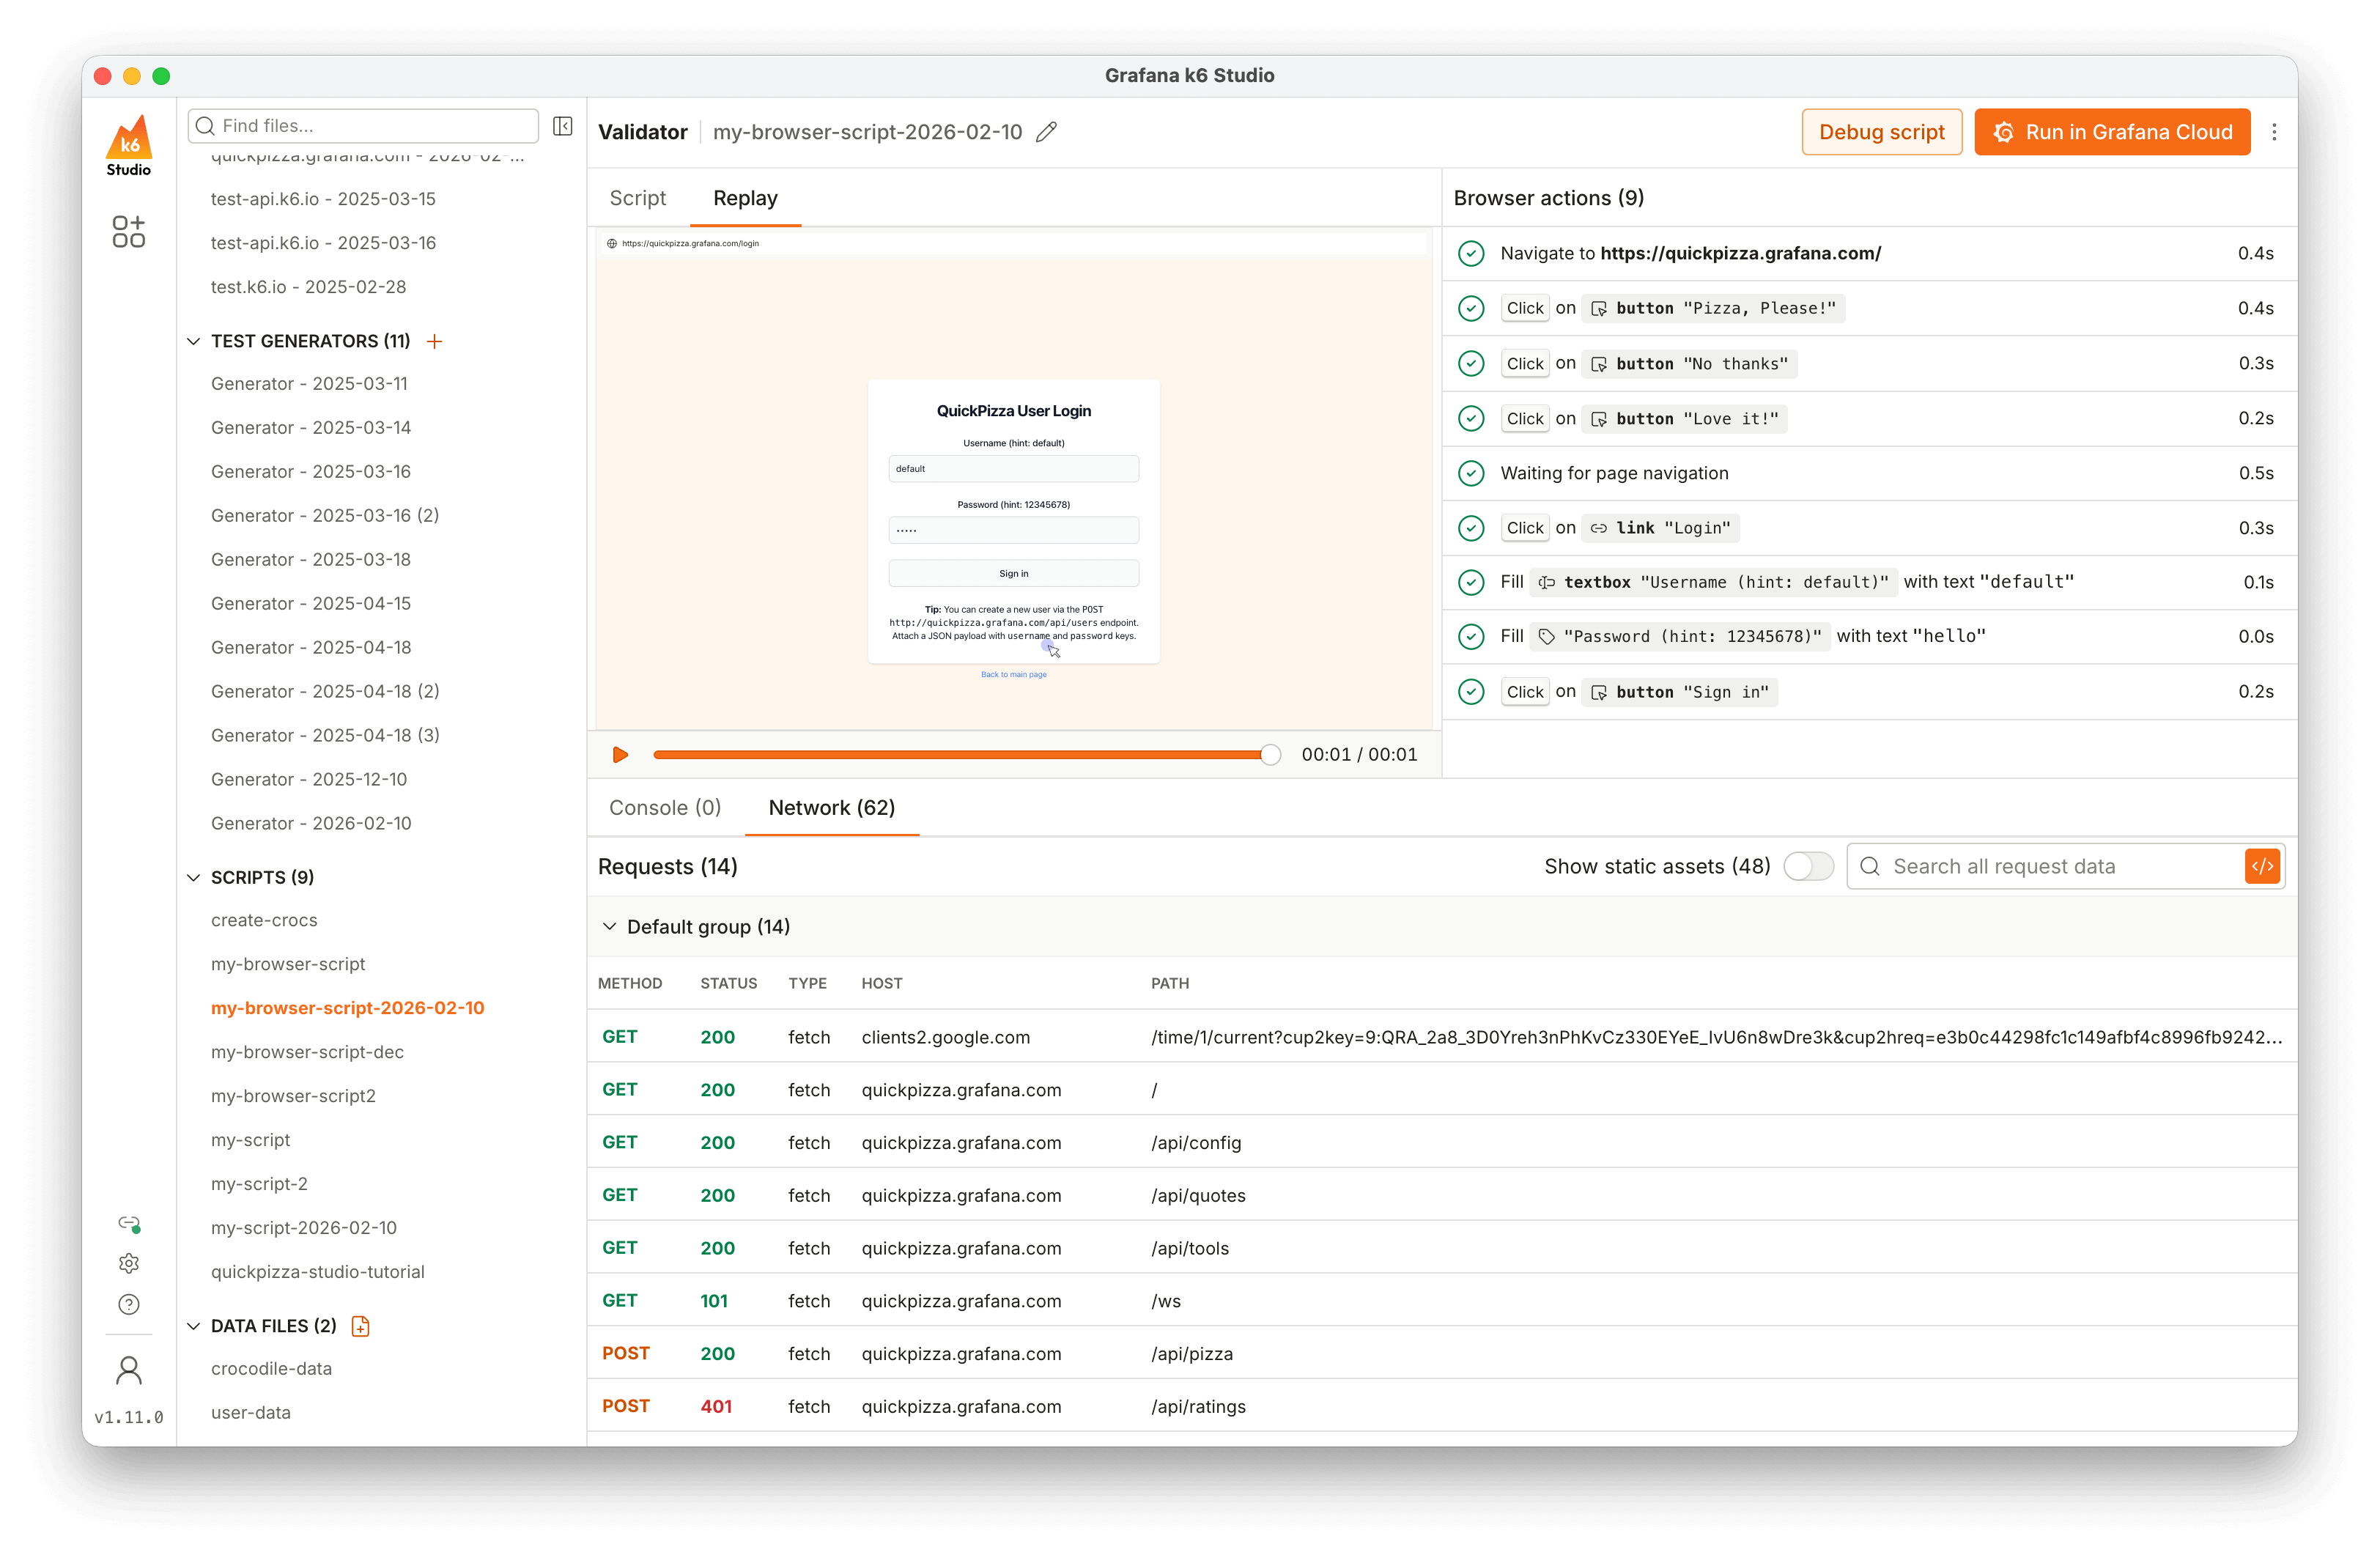
Script and Replay
From here, you can inspect the executed script, or view the session recording.
Browser actions
This panel shows the interactions made by the script and their outcomes. If an interaction failed, the reason for the failure is shown.
Console
Any logs emitted either by the browser or the test script.
Requests
A list of requests made by the browser. This is similar to the request list in an HTTP test.
Validate external script
You can use the Validator to debug scripts that are created outside k6 Studio as well:
- From the k6 Studio homepage, click Validate script.
- Click Open script.
Alternatively, from the Validator screen you can:
- Click the menu options icon on the top-right.
- Click Open external script.
You can then select a script located outside of k6 Studio, and then click Debug script to execute one iteration of the test.
If you want to view the script under the Scripts section of the k6 Studio application, you can:
- Open the k6-studio Scripts folder.
- For macOS, that can be found in
~/Documents/k6-studio/Scripts. - For Windows, that can be found in
C:\Users\<USERNAME>\Documents\k6-studio/Scripts. - For Linux, that can be found in
~/Documents/k6-studio/Scripts. - If you have a script in k6 Studio already, you can right-click on it and click Open containing folder.
- For macOS, that can be found in
- Copy your script to the Scripts folder.
After that, you should be able to see your test script in k6 Studio under Scripts.