
How Wells Fargo modernized its observability stack with Grafana Enterprise and Grafana Cloud
Think of a monitoring tool — any monitoring tool. Got it? Good. Odds are, whatever came to mind was probably being used behind the scenes at Wells Fargo not too long ago.
“You name it, and we probably had it at Wells Fargo,” said Senior Software Engineering Manager Nikhilesh Tekwani of the complex web of observability solutions that stretched across the U.S.-based financial institution.
Juggling multiple vendors was just one of several issues Tekwani struggled with in late 2021 as he led the efforts to modernize the observability strategy at one of the United States’ Big Four banks. The Observability Engineering Team also faced challenges with legacy solutions that required manual support, disparate databases, and a vast number of legacy alerts that were deemed non-actionable, noise, or redundant.
“We had to undo what we had done to ourselves while remaining in control,” Tekwani said.
In his ObservabilityCON 2022 talk titled “Wells Fargo’s observability transformation, powered by Grafana Enterprise and Grafana Cloud,” Tekwani shared exactly what the team did to accomplish just that. He walked through how the team unified their observability data, migrated and automated alerts, and delivered out-of-the-box dashboards with Grafana Cloud and Grafana Enterprise — and he reflected on how far they have come in the past year.
Building a modern observability architecture
In late 2021, Tekwani’s team encountered serious challenges with their existing monitoring solutions. All of these legacy solutions lacked cloud readiness and could only collect a small set of metrics. There was also a lot of manual work taking up developers’ precious time.
“Our developers and SREs were reacting to issues rather than being able to prevent things from becoming issues in the first place,” said Tekwani.
At the beginning of their transformation journey, the team articulated their core strategy: to deliver consistent, actionable, and business-value-driven observability capabilities at a competitive price, utilizing open source and open standards. They also identified three goals:
- Modernize in order to reduce cost of failure
- Improve availability for applications
- Optimize engineering capacity by automating and reducing manual work
Implementing Grafana Agent and Grafana Mimir
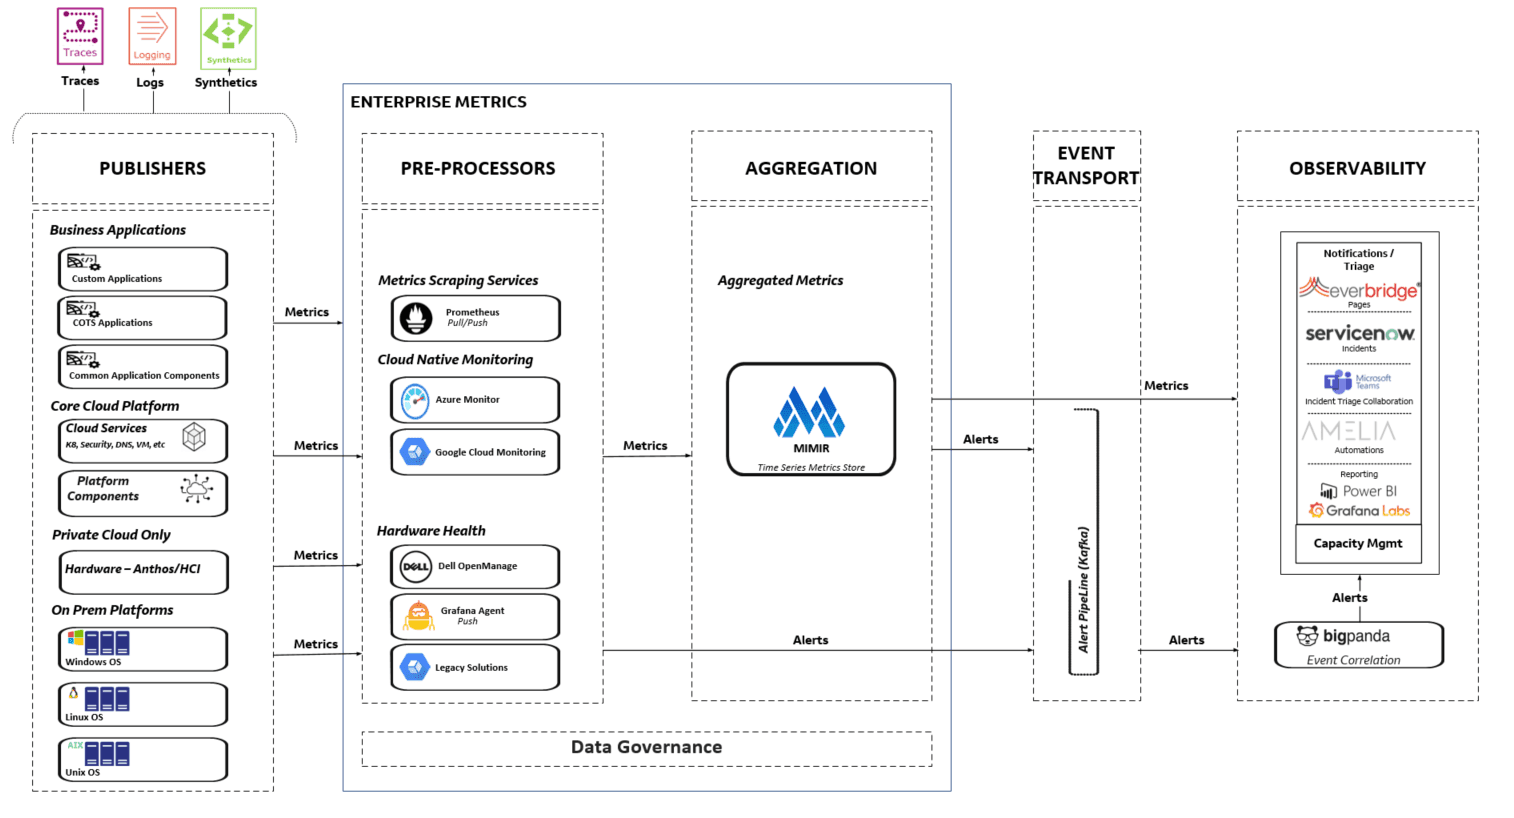
The first step to achieving Wells Fargo’s observability goals was to define a new architecture. Utilizing Grafana Agent and other tools to collect and transform their monitoring data, the team was then able to aggregate and visualize everything via Grafana Cloud. “We have Grafana Agent collecting data from our Linux and Windows OS platforms,” said Tekwani.
The team zeroed in on Grafana Mimir for the data aggregation layer of their observability architecture. “That’s where the magic of partnering with Grafana is,” said Tekwani. The Mimir Alertmanager allows them to write alerts, which are then fed into Big Panda for event correlation. From Mimir, Wells Fargo’s metrics flow into the observability layer, where the team can visualize data in Grafana dashboards and integrate with other vendors like ServiceNow for incident management.
Migrating legacy alerts to Grafana Cloud
The biggest challenge the team faced in modernizing their observability stack was migrating legacy alerts. “We had over 25,000 alert rules catering to 4,000-plus application teams,” said Tekwani. “They all had to be extracted and transformed.”
The team evaluated all of their existing alerts and pared them down by more than 15%, then migrated them over to Grafana Cloud. “Alexandre [de Verteuil] from Grafana Labs helped us a lot,” said Tekwani. “He and one of our engineers helped us put together Python scripts to transform legacy data into the correct file format so we could convert 21,000 legacy rules into code as a configuration.”

‘We’re just getting started’
After just 10 months of work, the team had delivered on many of their major goals.
With their visualization standardized in Grafana Enterprise and Grafana Cloud up and running, the team has built a library of out-of-the-box Grafana dashboards for their application, operations, SRE, and product teams. “Our active metric consumption has also increased from zero to 100 million metrics per minute,” said Tekwani, who is looking to hire more engineers to build out his observability team. “And we’re just getting started.”
There’s still work to be done, but Wells Fargo’s journey to a modern, integrated observability stack is off to a great start, thanks in part to their partnership with Grafana Labs. “We have come a long way together in a short time,” said Tekwani. “We are modernizing a very large system, and it takes time. But we want to celebrate the wins, learn from our setbacks, and continue with stepping stones over milestones.”
Watch the full ObservabilityCON session to see how Wells Fargo transformed their observability strategy in less than a year. All our sessions from ObservabilityCON 2022 are now available on demand.

