Continuous profiling for native code: Understanding the what, why, and howContinuous profilingGrafana Cloud Profiles
Show me the (meeting) money: How to monitor the real-time costs of a meeting in GrafanaGrafanaDashboard
From pillars to rings: How interconnected observability in Grafana Cloud optimizes performance and reduces telemetry wasteGrafana Cloud
Baking in site reliability with observability and AI: How SpotOn uses Grafana Assistant to keep restaurants runningAI
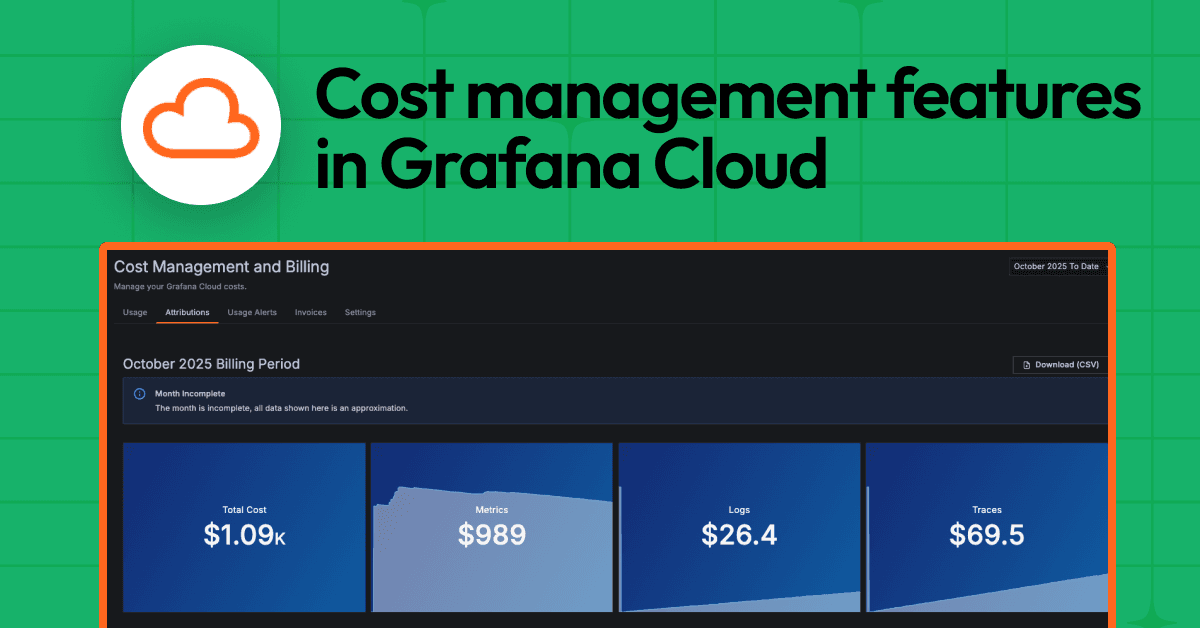
Managing observability costs at scale: A look at the latest cost management features in Grafana Cloud Grafana CloudCost management
Maximize data value and cut costs: Adaptive Telemetry for metrics, logs, traces, and profiles in Grafana CloudGrafana CloudCost managementAdaptive Telemetry
The observability maturity curve: How IT leaders are shifting from tools to outcomesGrafana CloudSLOsAI
Grafana Labs Co-founder Woods: Market maturity, OpenTelemetry, and AI are reshaping observabilityOpenTelemetryAI
Lighting up your dashboards: How to visualize the CheerLights IoT project in Grafana CloudGrafana CloudIoTDashboard
Grafana 12.2 release: LLM-powered SQL expressions, updates to canvas and table visualizations, simplified reporting, and moreGrafana
Single-tenant vs. multi-tenant architecture with Grafana Cloud: A guide to choosing the right approachSecurity
Baking in site reliability with observability and AI: How SpotOn uses Grafana Assistant to keep restaurants runningAI
The observability maturity curve: How IT leaders are shifting from tools to outcomesGrafana CloudSLOsAI
From pillars to rings: How interconnected observability in Grafana Cloud optimizes performance and reduces telemetry wasteGrafana Cloud
Managing observability costs at scale: A look at the latest cost management features in Grafana Cloud Grafana CloudCost management
Maximize data value and cut costs: Adaptive Telemetry for metrics, logs, traces, and profiles in Grafana CloudGrafana CloudCost managementAdaptive Telemetry
2026 observability trends and predictions from Grafana Labs: unified, intelligent, and openFind out which trends will shape observability in 2026, based on insights from 150 IT decision-makers and the engineers building Grafana Cloud.AIAdaptive TelemetryOpenTelemetrySLOs
Grafana 12.3 release: Interactive learning experiences, new and improved logs visualizations, and moreReleaseGrafana
Continuous profiling for native code: Understanding the what, why, and howContinuous profilingGrafana Cloud Profiles