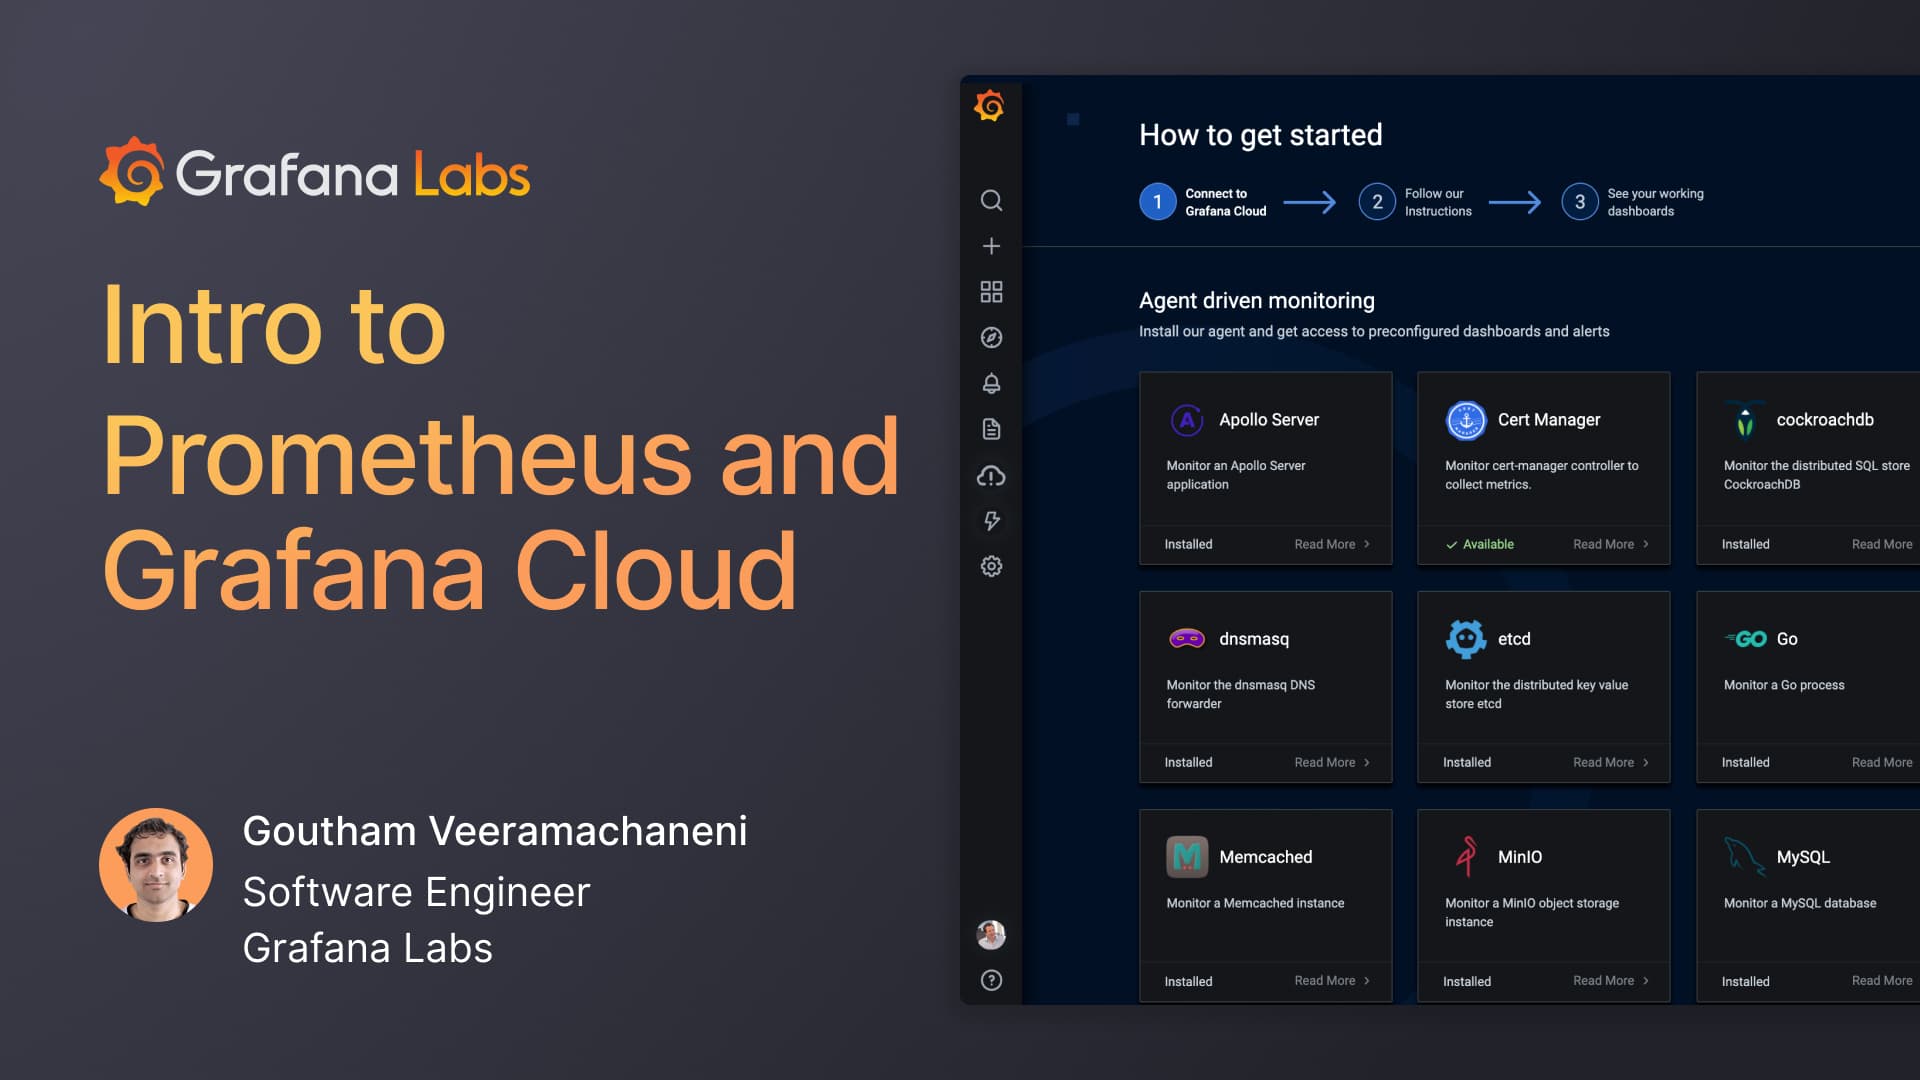
Don’t miss the Intro to Prometheus and Grafana Cloud webinar this week
Join us tomorrow, April 22, at 12:30 ET/16:30 UTC for a live intro-level webinar on Prometheus, led by project maintainer Goutham Veeramachaneni.

In this one-hour webinar, Goutham will give an overview of the open source project that’s the de facto standard for monitoring Kubernetes and modern, cloud native systems. He’ll then demo how easy it is to get started with Prometheus using Grafana Cloud, our composable observability platform. For complete beginners to Prometheus, he’ll show all the work the Grafana Labs team has done to make Prometheus extremely simple to adopt and use. You can get the metrics and alerts working in just a few minutes!
You can register for “Intro to Prometheus and Grafana Cloud” here. If you’re not already using Grafana Cloud, we have new free and paid plans to suit every use case — sign up for free now.


