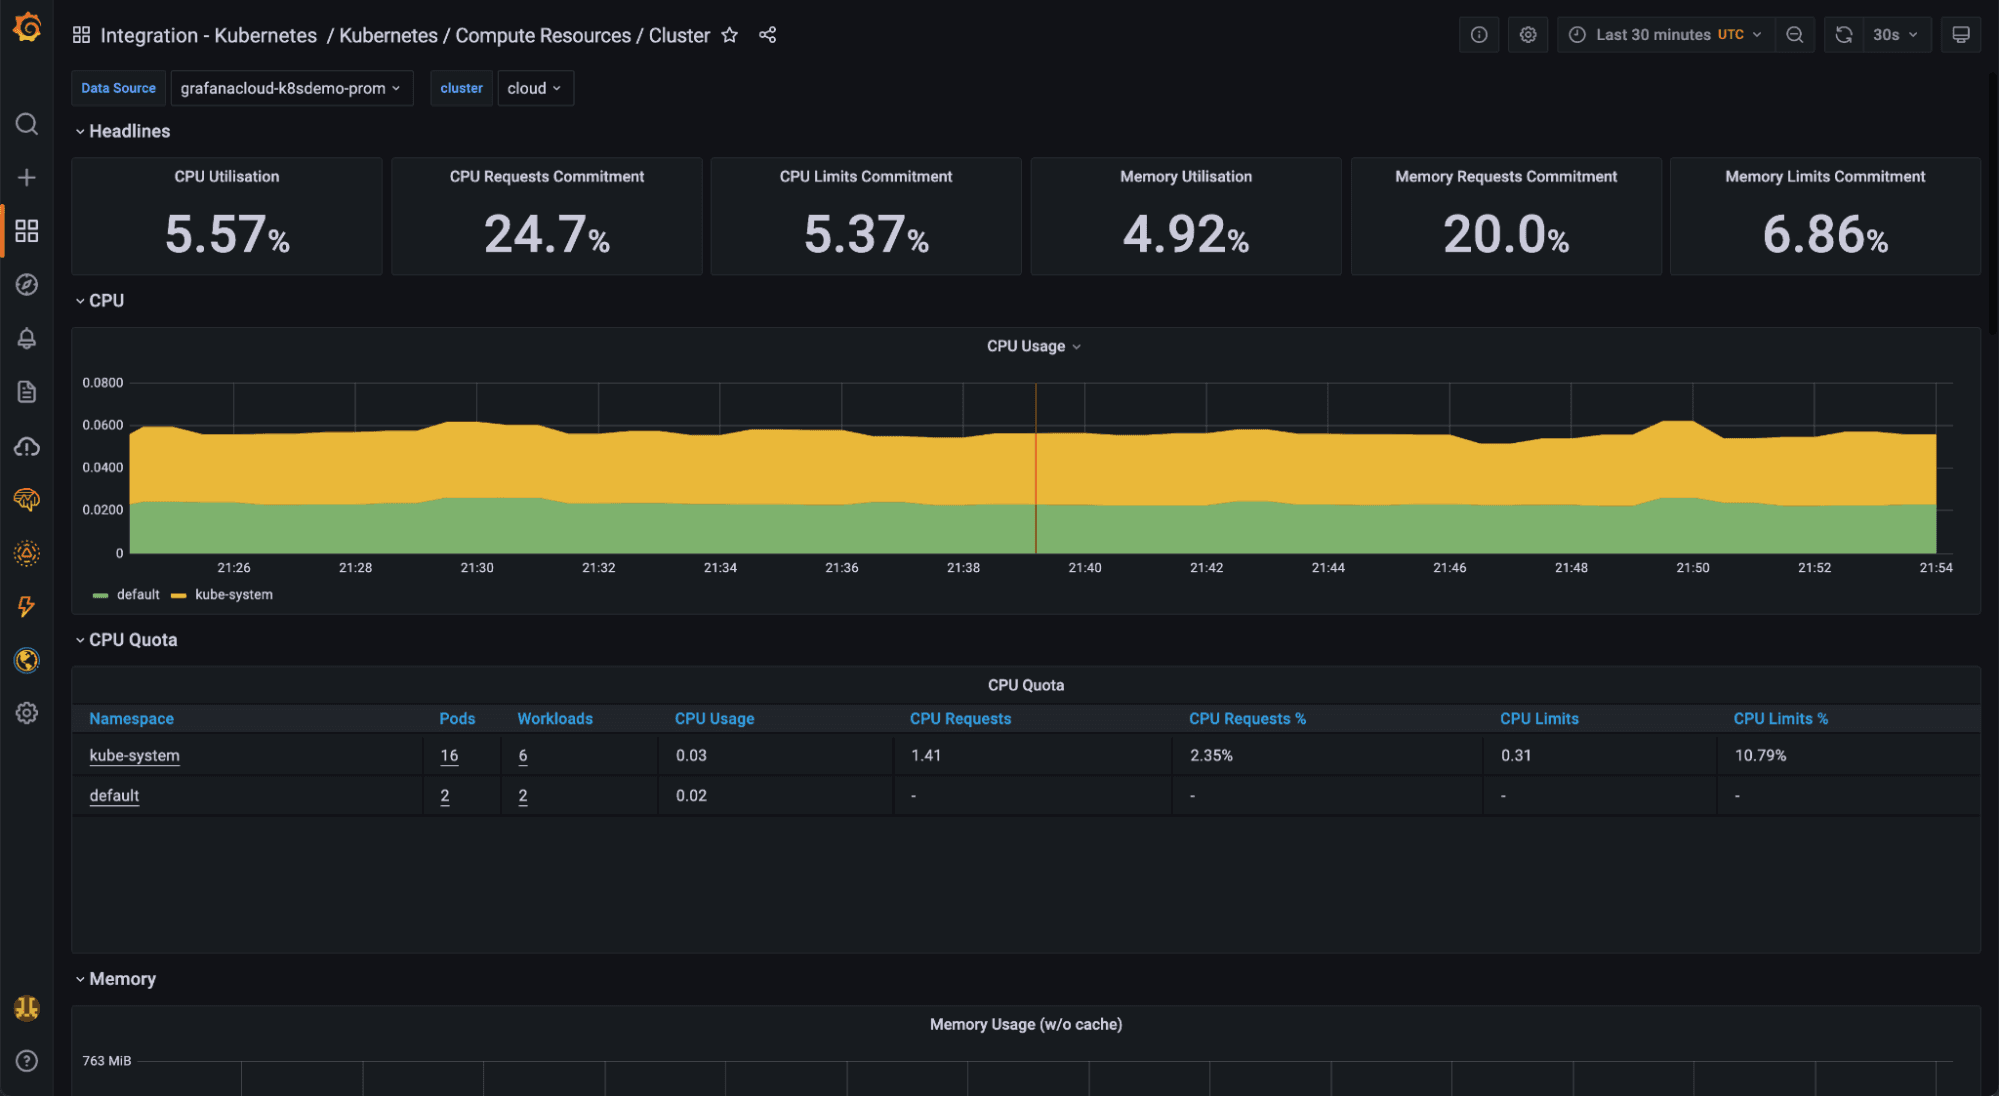
A 3-step guide to troubleshooting and visualizing Kubernetes with Grafana CloudKubernetesGrafana Cloud
ObservabilityCON 2021: Your guide to the newest announcements from Grafana LabsAlertingGrafana EnterpriseGrafana CloudKubernetesAWSLokiTempoTracingk6
What’s new in Grafana Cloud for October 2021: Machine Learning, Grafana 8.2, new integrations, and moreGrafana CloudGrafana
What’s new in Grafana Cloud for September 2021: New panels, query caching, synthetic monitoring updates, and moreGrafana CloudTempoLokiSynthetic monitoringMimir
What’s new in Grafana Cloud for July 2021: Traces, live streaming, Kubernetes and Docker integrations, and moreGrafana CloudTempoTracingIntegrationsAlerting
GrafanaCONline 2021: Your guide to the newest announcements from Grafana LabsGrafanaConGrafanaLokiTempo
ObservabilityCON 2020: Your guide to the newest announcements from Grafana LabsGrafanaLokiPrometheusTempo
September observability roundup: Run Prometheus-as-a-Service with the new Grafana Metrics Enterprise, ObservabilityCON, and moreGrafana CloudGrafanaPrometheus