

Instrumentation Hub: a guided, scalable way to roll out observability coverage without losing control
Getting started with observability in a modern, fast-moving environment is harder than it should be.
Open-standards-based observability promises flexibility and vendor neutrality, but in practice it often introduces significant complexity and delays meaningful coverage by months or even years. Each layer of the stack requires its own instrumentation approach, and every technology, runtime, and library version comes with unique setup steps, tradeoffs, and rough edges.
No single person or team has full visibility across the entire stack, since ownership is fragmented across the organization. The result is piecemeal instrumentation, uneven coverage, persistent blind spots, and ultimately a weaker return on your observability investment.
That's why we’re introducing Instrumentation Hub, a control plane for remote discovery and selective auto-instrumentation, now available in public preview for all Grafana Cloud users.
Instrumentation Hub: a more deliberate approach to observability
Instrumentation Hub is designed to scale observability without forcing teams into manual set up or indiscriminate collection. It provides an opinionated, guided way to roll out and manage observability coverage. It combines remote auto-instrumentation for essential use cases with deliberate user control so teams can move fast without instrumenting blindly.
Instead of manually instrumenting services one-by-one, Instrumentation Hub lets teams remotely discover what’s running across their environment and selectively apply instrumentation where coverage is needed. Proven, out-of-the-box pipelines are deployed automatically, while decisions about what to instrument and how deeply remain explicit and reversible.
This avoids the two common failure modes of observability adoption:
- slow, brittle manual rollouts
- Indiscriminate auto-instrumentation that over-collects, drives up cost, and obscures signal quality
Instrumentation Hub keeps a human in the loop, but removes the need to touch each target directly, making it practical to govern observability across dynamic, fast-changing systems.
Observability is a progression
At ObservabilityCON 2025, we introduced the idea of a hierarchy of observability needs. Teams may start in different places, but the most effective path forward moves from broad, foundational coverage to narrower, deeper, and more customized insight.
At the base is infrastructure visibility, the foundation everything else depends on.
Above that is baseline service visibility: RED metrics and service relationships that provide a consistent, system-wide view so that teams can quickly triage issues and narrow the search space before going deeper.
From there, transaction-level insights become necessary. Distributed traces reveal application behavior across the full request path, exposing performance bottlenecks and dependencies that aren’t visible from the outside.
Finally, at the top of the hierarchy, is custom instrumentation. While tracing common libraries is often straightforward, application-specific logic is not. Manual instrumentation should be applied selectively, and only after the foundational layers are in place where it delivers clear value.

Instrumentation Hub is built around this progression. It helps teams adopt observability in the right order, without jumping straight to the most complex or most expensive options.
How Instrumentation Hub works
Instrumentation Hub starts with Grafana Alloy , our distribution of the OpenTelemetry Collector with native pipelines for Prometheus, installed via a single Helm command on your Kubernetes clusters.
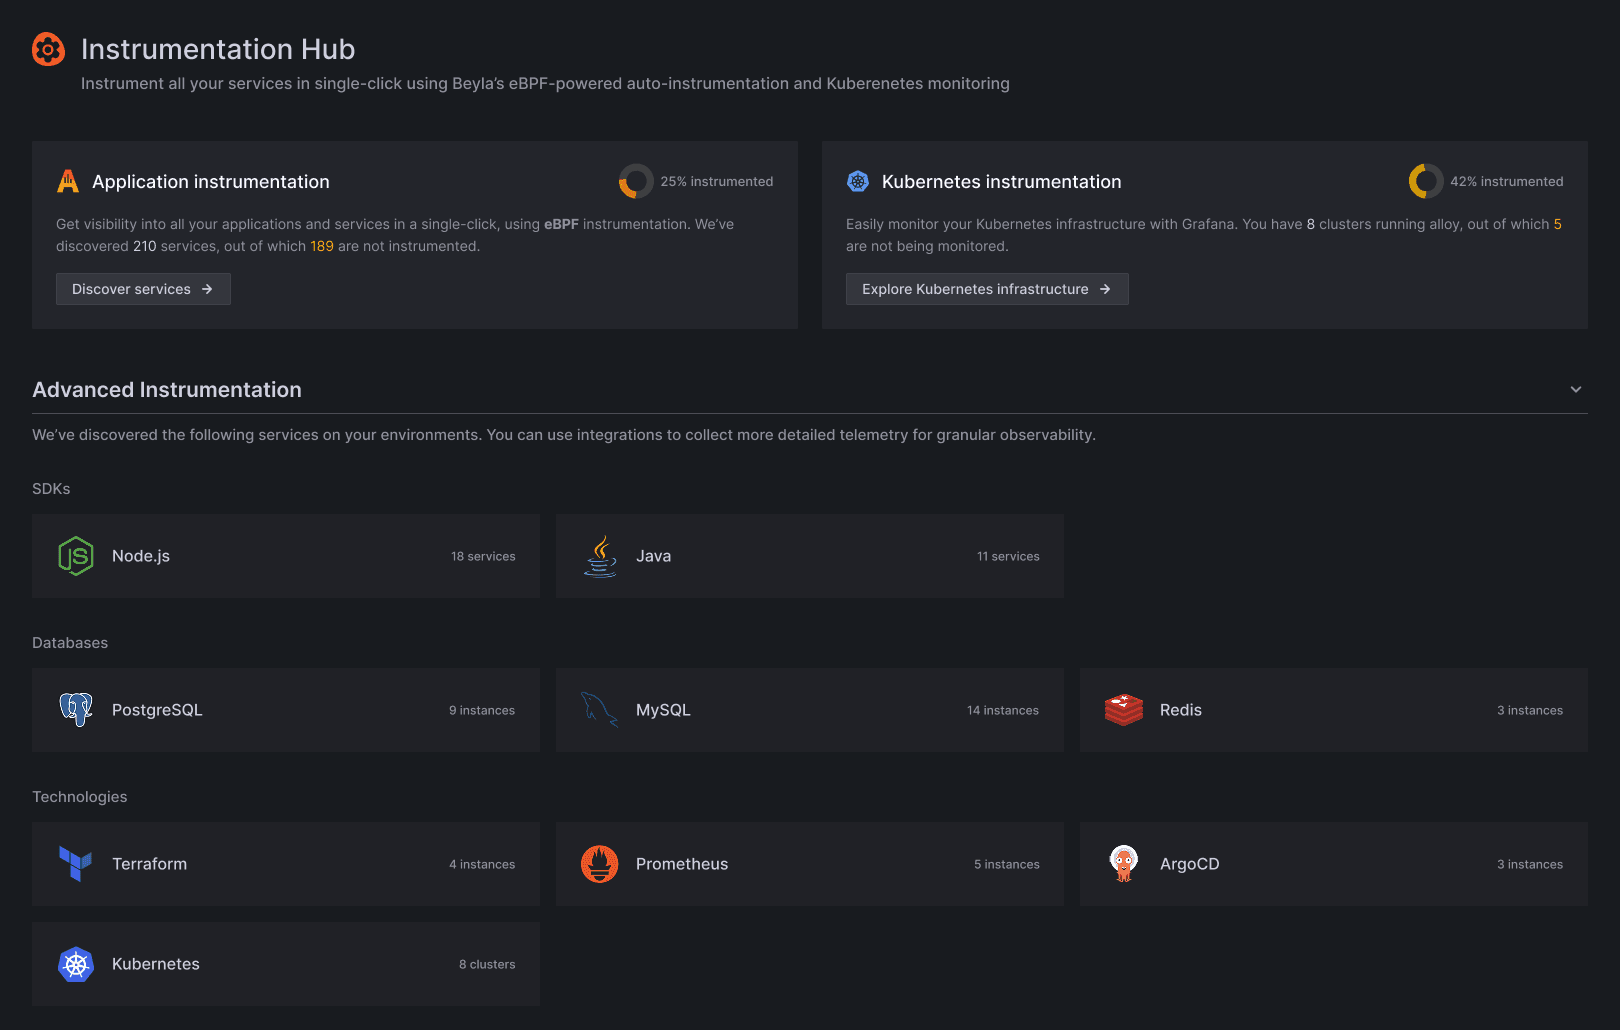
Once installed, Instrumentation Hub automatically discovers what’s running across your environment, building a catalog of services organized by namespace and technology so teams can immediately see what exists, what’s instrumented, and what isn’t.
From there, guided workflows walk you through instrumenting supported Grafana Cloud solutions. In the public preview, we will start with:
- Application Observability, for baseline service insights, correlated RED metrics, logs, traces, profiles, and a shared knowledge graph
In each workflow, the Instrument tab provides a point-and-click way to choose what to instrument and what data to collect. Under the hood, Instrumentation Hub deploys the necessary pipelines automatically. No manual configuration required.
Within minutes, you can begin exploring insights across your infrastructure and services.
Continuous control
Instrumentation Hub isn’t a one-time setup.
The Manage tab lets you adjust your observability posture over time. You can enable or disable specific data types, refine scope by namespace, and tune collection as needs change.
Need profiles for a misbehaving service? Enable them temporarily. Too many logs from a noisy workload? Exclude them. Trying to reduce spending? Dial back collection where it’s no longer needed.
Coverage and cost stay within your control.
Getting started
To get started, install Alloy using the provided Helm command, then navigate to Connections → Collector in Grafana Cloud to access Instrumentation Hub.
What’s next
Today, Instrumentation Hub focuses on infrastructure and baseline service visibility.
Next, we’ll move up the hierarchy introducing guided workflows and auto-instrumentation for deeper runtime insights using OpenTelemetry SDKs. We will also expand coverage in the infra layer for technology-specific integrations.
The goal remains the same: make observability easy to adopt, safe to evolve, and possible to scale without losing control as systems change.
Grafana Cloud is the easiest way to get started with metrics, logs, traces, dashboards, and more. We have a generous forever-free tier and plans for every use case. Sign up for free now!

