
Managing observability costs at scale: A look at the latest cost management features in Grafana Cloud
The benefits of observability are clear: deep visibility into system health, faster troubleshooting, and improved reliability (to name a few). But what’s equally clear is that, as organizations scale and evolve their observability strategies, they need a way to tap into these benefits without runaway costs.
According to Grafana Labs' 2025 Observability Survey, 74% of respondents say cost is a top priority for selecting tools. Another survey of 150 IT executives found that 41% of organizations increased their observability spending in the past year, with 55% predicting their spending will continue to grow in the next 12 months.
Recognizing this challenge, we’re always exploring new ways to help our users manage and optimize observability costs in Grafana Cloud. This means using technology to actively reduce your bill and foregoing "clever pricing," according to Tom Wilkie, CTO of Grafana Labs.
“We are one of the few, if not the only, observability companies out there to really prioritize this,” Wilkie said during the ObservabilityCON 2025 keynote this month.
From a centralized cost management app to our end-to-end Adaptive Telemetry suite, here are some of the Grafana Cloud features we’ve rolled out recently to help you control and optimize costs, especially as your observability strategy scales.
Reduce costs and noise across all observability pillars: Adaptive Telemetry
A common culprit behind ballooning observability costs is storing large, and often unnecessary, volumes of telemetry data.
“Observability costs and the volume of telemetry have really been rising exponentially,” Wilkie said. “And the common 80/20 rule applies: you're not actually using 80% of the data you're sending to your observability systems.”
Enter Adaptive Telemetry, a suite of features in Grafana Cloud designed to optimize observability data and costs by ensuring only the most valuable telemetry, spanning metrics, logs, traces, and profiles, is stored and surfaced. It uses intelligent classification and prioritization techniques to analyze how telemetry is used, and then automatically recommends actions like aggregating, sampling, dropping, or reducing low-value data.
The suite started with Adaptive Metrics and Adaptive Logs and, as of this month, now includes Adaptive Traces and Adaptive Profiles. This means Grafana Cloud users can extend the adaptive model across their end-to-end observability stacks.

Here’s a closer look at each feature:
- Adaptive Metrics (general availability): Helps you identify and eliminate unused or partially used time series data through aggregation.
- Adaptive Logs (general availability): Reduces log volume and associated costs by automatically identifying and removing low-value logs that are rarely or never used.
- Adaptive Traces (general availability): Uses tail sampling to automatically identify and retain your most valuable traces, ensuring you get the critical performance insights you need (and nothing you don’t).
- Adaptive Profiles (private preview): Dynamically adjusts data collection based on workload behavior, allowing you to deploy continuous profiling more broadly across your infrastructure without incurring excessive costs. (Interested in joining the Adaptive Profiles private preview? Please complete this form and we’ll be in touch.)
So far, our users have seen some pretty powerful results with Adaptive Telemetry, from reduced alert fatigue to significantly lower storage and processing costs. For example, on average, organizations using Adaptive Metrics see a 30%-50% reduction in telemetry costs.
To learn more about Adaptive Telemetry and how it works, please check out our technical documentation and this overview video.
Centralized control of your observability spend: Cost Management and Billing app
When multiple teams across your org are generating telemetry data, it can be difficult to know who, exactly, is accountable for the costs — and even more difficult to get a big-picture view of your total spend.
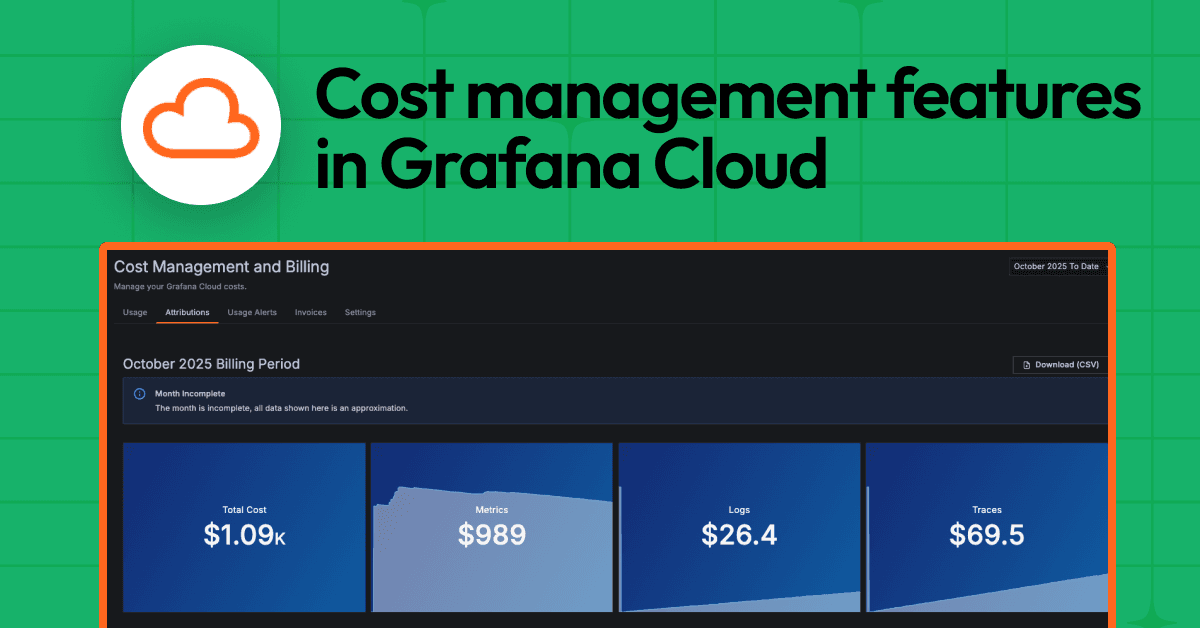
With the Cost Management and Billing app in Grafana Cloud, you get complete, centralized visibility into your Grafana Cloud usage and spend so you can stay in control of your observability budget. It can help underpin your organization’s FinOps strategy by offering transparency around overall spend, and establishing cost accountability across departments and teams.

Key features include:
- Cost attribution: Break down costs by label, such as a team or project, for better accountability.
- Usage-based alerts: Set usage alerts to detect spikes early and prevent unexpected charges.
- Invoice management: View and download monthly invoices directly in the app.
- Spend insights: Track costs across metrics, logs, traces, and other observability data, all in one place. Compare month-over-month spending trends to identify changes and optimize spend.
The Cost Management and Billing app is generally available in Grafana Cloud. To learn more, please visit our docs.
Use existing CSP discounts and credits: Grafana Bring Your Own Cloud
We know many of our users have existing discounts and credits with cloud service providers (CSPs), and want them to be able to leverage those discounts while using Grafana Cloud.
Grafana Bring Your Own Cloud (BYOC) is a deployment option that allows you to do just that by running Grafana Cloud within your own AWS or Google Cloud Platform (GCP) account (Azure support is currently available on a case-by-case basis). You pay the infrastructure bill directly, so you can take advantage of any discounts, credits, or commitments you’ve already negotiated with your CSP.
“BYOC provides mega-scale customers a fundamentally new economic model for when traditional SaaS pricing stops making sense,” Wilkie said.
In addition to being cost effective, Grafana BYOC offers the following benefits:
- Data residency: All Grafana Cloud services are run in your account, so you know all your observability data stays there, too.
- Managed service: Our team handles operations, scaling, and upgrades so your engineers can focus on more important things, like delivering business value.
- Feature parity: You get to benefit from rapid feature releases and all the latest enhancements in Grafana Cloud, including Adaptive Telemetry, running in your environment.
Grafana BYOC is designed for large enterprises with high telemetry volumes and complex observability needs. To learn more, please visit our BYOC page.
Apply open standards to cloud cost management: The FOCUS specification
At Grafana Labs, we often say that open source is in our DNA. Earlier this year, we extended that philosophy to cost management by adopting the FinOps Open Cost and Usage Specification (FOCUS), a community-driven, open specification that standardizes cost and usage data across cloud vendors to reduce complexity for FinOps practitioners.
Supported by the FinOps Foundation, which is a project of The Linux Foundation, FOCUS is designed to give organizations a consistent, vendor-neutral way to understand and analyze their cloud costs.
Access to standardized usage and cost data makes it easier for Grafana Cloud users to integrate their billing data into existing FinOps reporting, and to proactively identify optimization opportunities across their observability workloads.
“As FinOps is being applied to new scopes, especially to software as a service, a unifying billing format is becoming essential for streamlined cost management," said Lorant Kiss, Senior FinOps Manager at Delivery Hero. “Grafana Labs’ adoption of the open source FOCUS billing specification will enable incremental efficiency gains via more timely, detailed, and standardized cost information.”
FOCUS billing data is currently available in private preview in Grafana Cloud. If you’d like early access, please complete this FOCUS interest form or talk to your Grafana Labs account representative.
Other tools and tips to optimize Grafana Cloud costs
In addition to the new features outlined above, here are some other tools and practices you can use to control observability costs as you scale:
- Continuous profiling: Continuous profiling tools, like Grafana Cloud Profiles, provide code-level visibility to identify performance bottlenecks, optimize resource use, and reduce infrastructure costs.
- Cost Overview tab in Kubernetes Monitoring: Providing a detailed view of your total compute costs, average cost per pod, and average pod count, the Cost Overview tab in Grafana Cloud Kubernetes Monitoring gives you greater control over your Kubernetes infrastructure spending.
- Visibility into data points per minute (DPM): DPM helps you understand how much data you’re sending to Grafana Cloud — and whether it’s more than you need. Here are some best practices for investigating and reducing high DPM.
Grafana Cloud is the easiest way to get started with metrics, logs, traces, dashboards, and more. We have a generous forever-free tier and plans for every use case. Sign up for free now!

