ObservabilityCON 2024: Major news announcements, product updates, and a new startup program
Note: As of Feb. 20, 2025, the Explore apps (Explore Metrics, Explore Logs, Explore Traces, Explore Profiles) are now the Drilldown apps (Metrics Drilldown, Logs Drilldown, Traces Drilldown, Profiles Drilldown).
Today at ObservabilityCON 2024 in New York, we unveiled a number of updates to simplify observability, help users save time and reduce toil, and enhance their overall efficiency and cost-effectiveness through new AI-powered features.
“Today’s announcements represent a significant leap forward in making observability easier, more efficient, and more intelligent,” said Tom Wilkie, CTO of Grafana Labs. “We’re not just improving our tools; we are completely changing how DevOps teams and SREs interact with their systems and data, simplifying their everyday activities.
Check out the keynote to learn more, and read on for a quick recap of all the news from ObservabilityCON 2024.
The Explore apps suite for a queryless user experience
One of our biggest goals here at Grafana Labs is to make observability solutions that are not only powerful, but are also accessible and easy to use.
Today, we’re announcing public previews of Explore Traces and Explore Profiles, which join Explore Metrics and Explore Logs — now generally available — to create a full suite of Explore apps for Grafana and Grafana Cloud. These apps streamline data exploration and analysis through intuitive, point-and-click UIs, enabling users to drill down and visualize data without having to know query languages like PromQL, LogQL, or TraceQL.

To learn about Explore apps, check out our blog post.
Contextualized root cause analysis workflows in Grafana Cloud
Since acquiring Asserts.ai in 2023, we’ve been hard at work, integrating Asserts technology — which leverages AI/ML to offer an automated approach to correlating anomalies — with Grafana Cloud. And today, we’re so excited to share the results of those efforts.
We’re introducing a suite of unified workflows connecting Asserts and Grafana Cloud solutions that helps automate the correlation of anomalies across infrastructure and application layers to provide a more cohesive troubleshooting experience. The workflows cover a wide range of monitoring needs, including application performance, Kubernetes workload monitoring, infrastructure monitoring, real user monitoring, and simplified SLO management. These AI-driven inferences enable even junior engineers to more effectively understand and diagnose issues in complex systems.
We’ve started rolling out these new capabilities, and by Oct. 2, all Grafana Cloud Advanced customers will have access to Asserts and these integrated workflows from the Grafana Cloud navigation menu. (Note: Kubernetes Monitoring in Grafana Cloud will be required to run Asserts. Our system will automatically analyze your setup and guide you through the onboarding process.)

Read more about this new suite of unified workflows connecting Asserts and Grafana Cloud solutions in our blog post.
Reduce costs with the growing set of Adaptive Telemetry features
Adaptive Logs, which is generally available today in all Grafana Cloud tiers, helps users lower their observability costs by reducing the volume of unnecessary logs. It does so by identifying commonly ingested log patterns and creating a set of customized sampling recommendations based on how frequently those patterns are queried. This gives you the ability to prune away low-value logs so you only retain the important ones.

Adaptive Logs builds on the momentum of Adaptive Metrics, which has helped users see a 35% reduction in metrics costs, on average. Both Adaptive Logs and Adaptive Metrics leverage AI/ML techniques to analyze observability data at a scale that wouldn’t be feasible with manual processes. And we’re working on extending this concept to traces as well.
To accelerate the development of Adaptive Traces, we’re pleased to announce the acquisition of TailCtrl, an early-stage company founded by Sean Porter, a tenured engineer and entrepreneur who previously co-founded Sensu. Sean’s expertise aligns with our vision for Adaptive Traces, which is now in Research phase.
To learn more, check out our blogs on Adaptive Logs and the TailCtrl acquisition.
Powering the next generation of startups with Grafana Cloud
We want to help more organizations get up and running with observability, which is why we’re launching the Grafana Labs Startup Program. Offering eligible startups up to $100,000 in Grafana Cloud credits for 12 months or until their next funding round, this initiative aims to encourage startups to adopt Grafana Labs’ scalable, open, and composable observability solutions from the outset, avoiding future vendor lock-in.
Participants will receive all products within Grafana Cloud including all Enterprise plugins, Grafana support, and access to Grafana Labs’ business development team for ecosystem integration. We’re targeting startups with less than $10 million in funding and fewer than 25 employees, though exceptions may be considered.
If you’re interested in applying, please read our blog on the Grafana Labs Startup Program for more information.
More ways we’re advancing AI/ML in observability
LLMs are becoming more prevalent in our users’ day-to-day work, so we’re developing various ways to monitor and observe them:
- With Nvidia as a design partner, we built a tool to track ML experiments and compare performance by charting model metrics (loss vs. epoch, etc.) and monitoring application logs for failures. The open source tool contains a Python library to instrument training code, a backend written in Go to store data about training runs, and a Grafana plugin to visualize data in Grafana.
- We’re exploring ways to use open source tools to observe LLMs, including the OpenLIT SDK. The SDK produces OpenTelemetry traces and metrics for the LLM calls including latency, cost, and the number of tokens generated. These metrics and traces can be sent to Grafana Cloud and visualized using the AI observability solution. The integration code is open source and available on GitHub.
- We built GPU monitoring using eBPF, which helps AI developers get fine-grained information about their workloads without manual instrumentation. This feature is currently available as a branch in Grafana Labs’ open source eBPF project Beyla.
In addition to observing LLMs, we’re also incorporating them into Grafana Cloud with Incident Rooms, which provide real-time transcription for incident bridge calls. With this Experimental feature, a bot will transcribe conversations directly into an incident timeline, using LLMs to summarize and capture critical insights that might otherwise be missed.
Enhanced monitoring and testing capabilities in Grafana Cloud
Synthetic monitoring and load testing
Earlier this year we introduced a revamped version of Grafana Cloud Synthetic Monitoring powered by Grafana k6 to enable users to simulate the most complex transactions and user journeys. Today, we’re announcing the unification of Synthetic Monitoring and k6 with a focus on making authoring tests easy with three new features in Grafana Cloud:
- k6 Studio: A GUI-based, low-code test authoring tool you can use to create tests without hand-scripting in JavaScript. (Experimental)
- Scripted Monitoring: Perform comprehensive black-box synthetic monitoring of services using JavaScript for complex user journey simulations, custom validations, and flexible retry policies. (Public Preview)
- Browser Monitoring: Run a real browser and render the entire web page to capture Web Vital metrics, screenshots, and timings so you can validate the full frontend user experience. (Generally Available in Grafana Cloud k6, and coming soon to Synthetic Monitoring.)
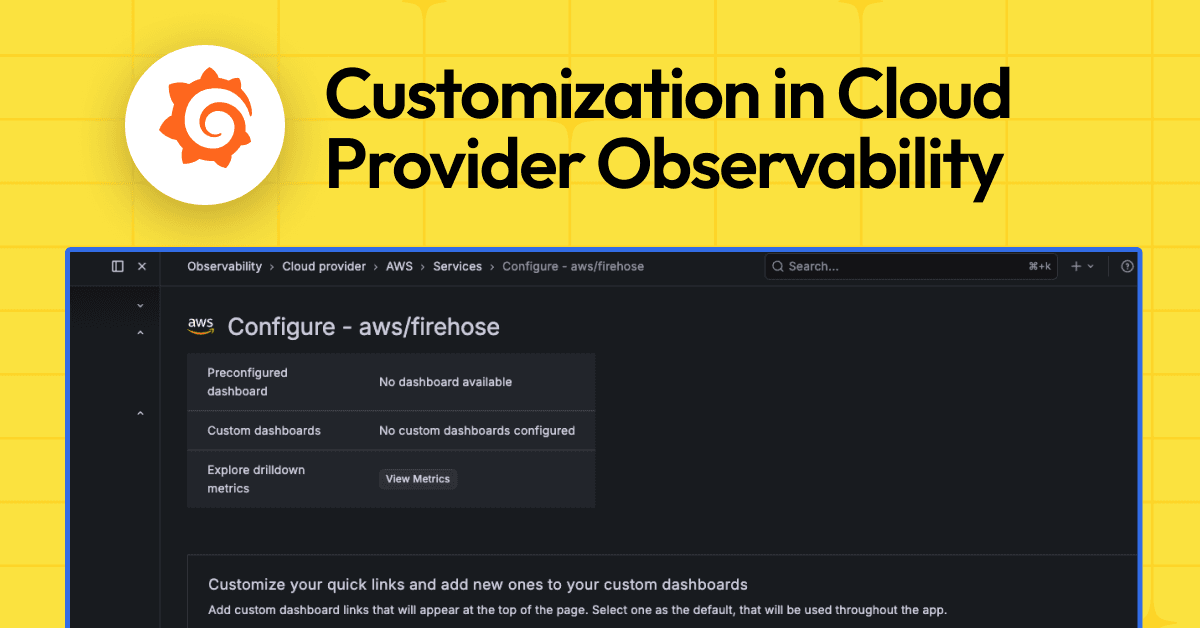
Multi-cloud monitoring with Cloud Provider Observability
Managing multi-cloud environments often means juggling different monitoring tools for each provider, leading to increased complexity and operational overhead. To address those challenges, we announced today that Cloud Provider Observability — an application for monitoring AWS, Microsoft Azure, and Google Cloud services, all in Grafana Cloud — is now generally available. Cloud Provider Observability simplifies multi-cloud monitoring and provides more comprehensive insights across cloud services with a single, out-of-the-box observability solution that is easy to set up and scale.
For all the latest updates from ObservabilityCON 2024, follow Grafana Labs on Twitter and LinkedIn or join the Grafana Labs Community Slack.