
Grafana Alerting: 12 ways we made creating and managing alerts easier than ever
Since the release of Grafana 9.0, we have been listening to feedback for Grafana Alerting from both our customers and the Grafana community forums. We have heard many of your recommendations, suggestions, and frustrations and have made significant improvements to Grafana Alerting since it became generally available last year.
Here at Grafana Labs, we are always striving to improve our product and provide the best possible experience for our users. Over the past 12 months, we have made significant improvements to make creating and managing alerts in Grafana easier. From enhancing existing features to introducing new ones, we have worked hard to ensure that our alerting product is more user-friendly, efficient, and effective than ever before.
In this blog post, we want to take a moment to reflect on the progress we have made and share some of the exciting updates and new functionalities we have implemented. So without further ado, let’s dive into what we’ve accomplished in the past year!
1. New Grafana Alerting landing page
We have created an entirely new landing page with the release of Grafana 9.4. Here you can find an introduction to Grafana Alerting, including a summary of how it works, links to the documentation, and a short video showing how to get started with Grafana Alerting.

2. Redesigned expressions pipeline
The design of expressions has been completely revamped to make them more compact and use up less screen space, resulting in a more user-friendly experience.
We’ve made some changes to the data flow, which now separates the expressions from the QueryEditor, so that the QueryEditor only manages data queries. As part of this, Preview has been merged into the expressions pipeline, and it has been removed for Grafana-managed rules.
We’ve also made a concerted effort to improve the way you connect expressions, including the introduction of default input parameters, which removes the need for constant reference ID updates.

3. Alert rules search improvements
Finding alert rules has become even easier. Previously, the search function only allowed you to filter rules based on their names and labels. However, with our latest update, our search syntax now supports a hierarchical structure where we can apply filtering on different levels of the structure, such as folders, evaluation groups, and rules. Additionally, we can filter rules by their properties like labels, state, type, and health.

4. Copy existing alert rules
We received a lot of feedback on the community forum and GitHub to allow copying existing alert rules. This is now possible in Grafana 9.4.
To copy an alert rule, you simply click the Copy button under Actions. You will then be taken to the Add rule page where all of the fields will already be filled from the rule you just copied. To save the copy, simply click the Save or Save and Exit button on the top right of the page.

5. Export alert rules for provisioning
Many Grafana users like to create and test alert rules in the user interface before adding them to their Terraform. However, before Grafana 9.4, there was no easy way to export your alert rules in a format that was compatible with the Alert Provisioning API. That changes with the release of Grafana 9.4 and the new Export button. You can now use the Export feature to download all of your alert rules in yaml. Simply add the file to the alerting provisioning folder and you are ready to start provisioning! You can find more information on file provisioning here.

6. Evaluation intervals explained better
We understand that many users find the evaluation interval confusing, which can result in misunderstandings and problems. To address this issue, we have improved our user interface to make it clear that the evaluation interval is associated with the group rather than the alert rule itself. This should help you better understand and manage the evaluation interval for your alerts.

We have also improved the group modal so it now displays a list of alerts for a group with their respective For values, providing you with more information when modifying the evaluation interval.
The table also includes a hint on the number of evaluations required before the alert triggers. An error badge is displayed in the For column for any alerts with an invalid value. Additionally, a form validation feature has been added to prevent you from updating with an invalid evaluation interval.

7. Improved action buttons
We are committed to improving the user experience and minimizing unnecessary clicks. As part of this effort, we have simplified the process for accessing the View, Edit, and Delete buttons for an alert rule. These buttons can now be found in the collapsed list, which eliminates the need to first expand the rule.

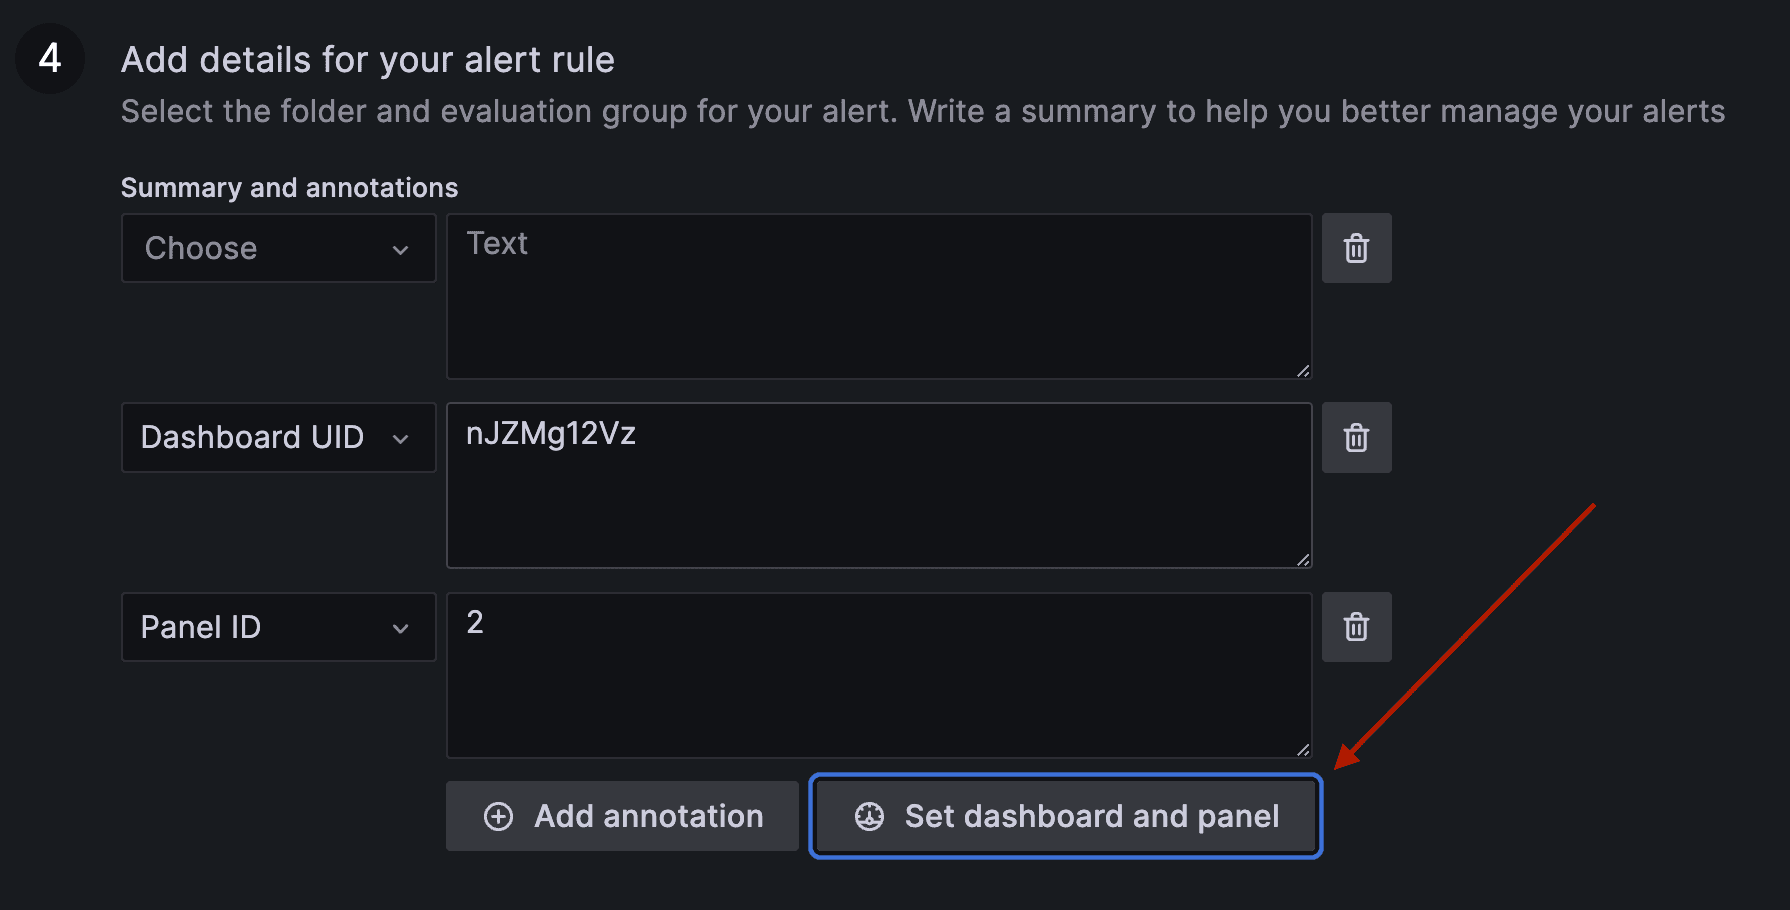
8. Added dashboard and panel picker to the rule form
You no longer need to remember dashboard and panel IDs to attach them to rules. Instead, you can select them easily from the visual selector, saving time and streamlining the process.

9. Create incidents from firing alerts in Grafana Cloud
You now have the ability to declare an incident directly from a firing alert in Grafana Cloud. This new feature streamlines the alert to incident workflow, making it easier and more efficient for you to manage alerts.
Thanks to this new feature, you can take immediate action and investigate alerts more efficiently, reducing response times and minimizing the impact of critical incidents. We believe that this new feature will greatly enhance the alerting experience for our users and improve the overall efficiency of their incident response and management (IRM) workflows.

10. Notification error feedback on contact points
We understand that troubleshooting notification delivery to contact points can be a challenging task.
To make it easier for users to identify and resolve issues, we have introduced a new API endpoint called /api/alertmanager/grafana/config/api/v1/receivers in Grafana 9.3. This endpoint allows you to quickly check if any contact points are failing, and a message in the UI’s right-hand corner alerts you to any errors and their number.
Additionally, the new Health column shows the status of each contact point, and hovering over the error provides the reason for the failure. These enhancements streamline the troubleshooting process, making it much easier for you to resolve any contact point-related issues.

11. Copy existing notification templates
In Grafana 9.4, it is now also possible to copy notification templates. To copy a template, you simply click the Copy button. You will then be taken to the edit page of the copied template.

12. Improved documentation for templating notifications
With the release of Grafana 9.4, we have completely rewritten the documentation on templating notifications following feedback on both GitHub and the Grafana community forum. The improved documentation comes with a tutorial on writing templates in Go’s templating language, how to create and use notification templates with a number of working examples, and a reference of all of the data available to you when writing templates.
What’s next for Grafana Alerting in Grafana 9.5 and beyond
We hope you like many of the improvements to the ease of use in Grafana Alerting that we have made since Grafana 9.0. However, we’re not stopping here. We have many more improvements planned for Grafana 9.5. You can see what’s planned next in our ease of use issue on GitHub.
To learn more, go to our Grafana Alerting documentation or visit our Grafana Incident & Response Management page.

