
GrafanaCONline 2021: Your guide to the newest announcements from Grafana Labs
In addition to all the great talks from community members about their use cases, GrafanaCONline 2021 will include a number of sessions with the Grafana team about the latest features and use cases for Grafana. Throughout the week, we’ll continue to unveil new features, go deeper with live demos, and share our plans about the future of Grafana.
From new visualizations and major performance improvements to top-requested features like unified alerting and fine-grained access control, there is a lot to share. With so many new announcements and features to check out, we want to make sure you know where to get more details about these developments. Here is your guide to all of the newest announcements from Grafana Labs.
Grafana 8.0
With Grafana 8.0, our goal was to provide users with new and improved ways to visualize data so they can get to work faster and enjoy more responsive interactions with their dashboards. This release includes brand new panels, plugin updates, advanced security and authentication features, improved startup and load performance, and more.
New ways to visualize data with panels
From status history to histograms, pie charts to bar charts, Grafana 8.0 includes fast and flexible visualizations that allow you to visualize your data, any way you want.
The new State timeline panel
The new State timeline panel shows the discrete state of changes over time. Using string or boolean data, users can combine this panel with the new value mapping feature to assign colors to each value, making it obvious to see the state transitions.
This panel is great for observability and industrial use cases where users need to visualize uptime, SLA conformance, sensor readings, or anything that’s in discrete states over time.

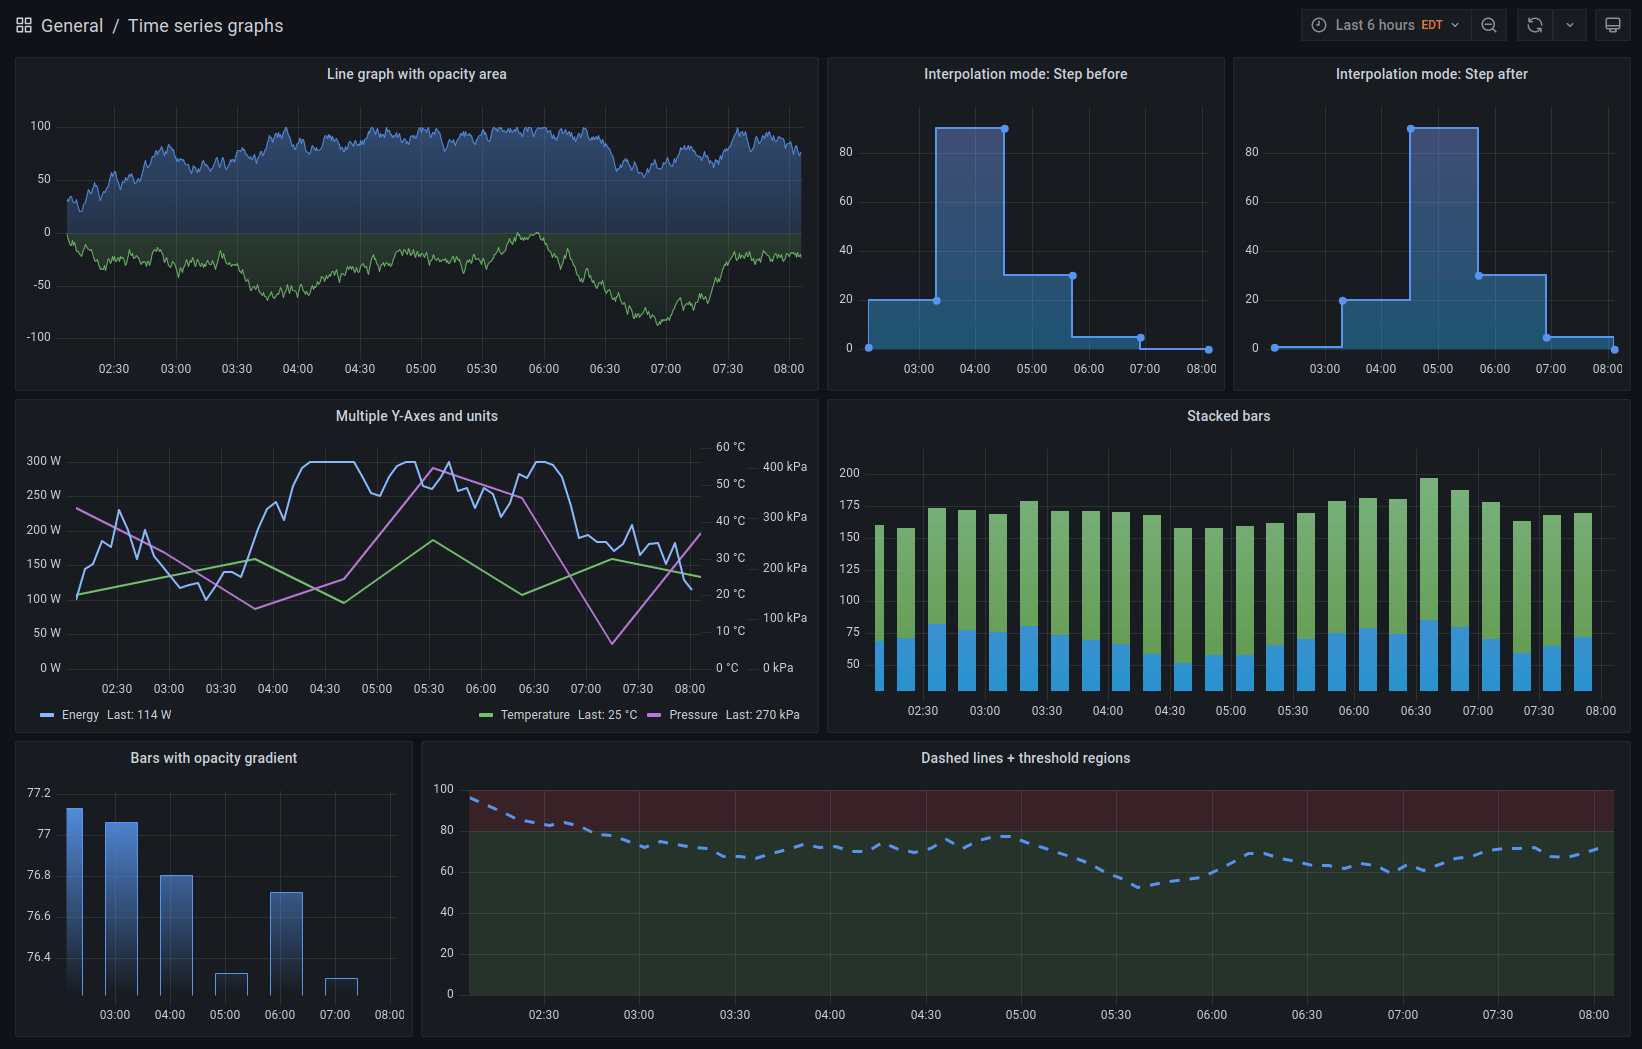
Time series panel is now the default visualization
Introduced in Grafana 7.4, the Time series graph panel is now out of beta and the default visualization option. It’s a high-performance visualization that provides users with better performance, more consistency and the ability to customize different aspects of the panel.
Library panels
As organizations add more users and create more dashboards, there may be more use cases for including the same panel on multiple dashboards. While it’s always been possible to copy panels onto various dashboards, it wasn’t possible to reuse the same panel in multiple dashboards and have them automatically update everywhere when changes are made.
Library panels solve this problem by allowing users to build panels that can be used in multiple dashboards. Any updates made on the original panel will then automatically be applied to all the dashboards where that panel has been added.
New Panel Edit features
With all of these additional panels and visualization options, we wanted to make it easier for users to explore and configure visualizations. To accomplish this, we have made some improvements to the Panel Edit UI.
The new Panel Edit features better navigation and discoverability of the available panel options users can now search all across all panel options and overrides. There is also a new table view toggle that allows you to quickly view the data being passed to the visualization in a table view.
More ways to extend Grafana through plugins
Plugin catalog
Users can now leverage the plugin catalog to easily install and manage Grafana plugins.

- For new users, the plugins catalog is a great place to browse and install a long list of plugins available with Grafana.
- Current Grafana users can use the plugins catalog to browse additional plugins, update, and uninstall plugins.
One of the more convenient features: Everything in the plugins catalog can be done without requiring a server restart.
Recently added and improved plugins
Adding and improving data source plugins is a critical element in Grafana Labs’ commitment to providing an open and composable observability platform. Data source plugins hook into existing data sources via APIs and render the data in real time without requiring you to migrate your data.
Be sure to check out some of the most recent plugins, including:
- Salesforce (in beta)
- Splunk Infrastructure Monitoring (formerly SignalFx)
If you’re already using Grafana plugins, look for new updates and improvements to the following plugins:
Security & authentication
With 8.0, Grafana Enterprise users will have options to increase security and user control with new features like fine-grained access control, query caching, and improved reports.
Fine-grained access control
Grafana Enterprise now includes fine-grained access control that allows admins to decide who can do what, to make sure users in their org have the right access level throughout Grafana.
Specifically, admins can add or remove permissions like:
- Allow creating reports
- Allow reading stats or licensing details
- Deny creating local users
This is great when your permissions model doesn’t fit the standard roles that come with Grafana.
Data source query caching
Grafana will now cache the results of backend data source queries, eliminating unnecessary duplicate queries and reducing dashboard load times — as well as costs.
Query caching stores results for a period of time, so that the next user to load a dashboard or run a query saves the round trip to the data source. This means snappier dashboards, reduced cost, and lower likelihood that users will hit the rate limit and pay for unnecessary queries. This is configurable globally or per data source, and it works with Redis, Memcached, or an in-memory cache.
Query caching will be especially useful for Grafana Enterprise customers who use:
- Metrics based on logs; e.g., Splunk, Elastic, Cloudwatch, etc.
- Big database queries from SQL data sources like Oracle and Postgres
- Incident dashboards, which get visited all at once by lots of users
- Heavy queries that refresh often
Reports
Grafana Enterprise customers will notice new tools that make reports more specific and help various report recipients explore data in a more interactive way. Now, with reports in Grafana Enterprise, users can:
- Select template variables for a report
- Export table panels as CSV files
- Link from a report back to its original Grafana dashboard
- Create reports more easily using an improved UI
- Include repeated panels and rows in reports
Learn more and get started with Grafana 8.0
- Join us June 9 at 9:00 PT, 12:00 ET, 16:00 UTC for the Grafana 8.0 deep dive session to see a demo and learn more about Grafana 8.0.
- Read the blog post about the Grafana 8.0 release.
- Take a look at what’s new in v8 in our new Grafana Play dashboard.
- Refer to Upgrading for more information about upgrading your Grafana installation.
Alerting
Over the last few years, alerting has been one of the most anticipated and requested features from the Grafana community, which is why we’re excited to share the brand new, unified Grafana alerts.
The new Grafana 8 alerts bring together Prometheus alerting and Grafana dashboard alerting, centralizing them into a single page for simplified viewing and management, including the ability to update and edit alerts from the same interface. That means there is no longer any need to navigate between different alerts and dashboards to find the correct information and updates — all alerting information is available in an intuitive, searchable view.

These new centralized features will work for those using traditional Grafana dashboard alerts as well as more complex Prometheus-backed alerts.
Furthermore, Grafana alerts now provide a common alerting for all Grafana users and data sources — whether you’re using the open source version or the Enterprise and Cloud stacks from Grafana Labs.
For this release, Grafana will still support the legacy Grafana alerts. In order to use the new alerting experience, users must opt in and enable a feature toggle to trigger the appropriate migration. Read the docs to learn how to enable this feature and what changes will occur.
Learn more and get started with Grafana Alerting
- Join us June 16 at 9:00 PT, 12:00 ET, 16:00 UTC for the What’s next for alerting in Grafana session to see a demo and learn more about Grafana alerting.
- Read the documentation on enabling Grafana alerting.
- Try out Grafana alerting in the cloud today.
Tracing
Tempo is GA with v1.0
During the opening keynote, we announced Grafana Tempo 1.0 is now available. Launched at Grafana ObservabilityCON in October 2020, Grafana Tempo provides a new, radically different take on distributed tracing, focusing on the efficient and scalable storage of traces using only object storage.
With Grafana Tempo, users are able to dive deeper into their observability data and pinpoint specific traces in order to answer questions like: “Why was this customer’s query slow?” “An intermittent bug showed up again. Can I see the exact trace?” By discovering traces through logs and exemplars, and storing the traces by ID in Tempo, organizations gain more visibility into their applications while simultaneously reducing their infrastructure spend.
Get Grafana Cloud Traces, FREE!
In addition to Tempo 1.0, we also announced the general availability of Grafana Cloud Traces, which integrates traces with metrics, logs, and dashboards in our fully managed Grafana Cloud observability stack. Users can analyze up to 50GB of traces at no cost in the free tier of Grafana Cloud.
Learn more and get started with tracing
- Join us June 10 at 9:00 PT, 12:00 ET, 16:00 UTC for the Open source distributed tracing with Grafana Tempo session to see a demo and learn more about Grafana Tempo.
- Read the blog post about the Tempo 1.0 release.
- Sign up for a Grafana Cloud account to quickly get started with Grafana Cloud Traces.
Logs
Better logs navigation
The previous logs view in Grafana’s Explore limited the display to the maximum number of lines returned from the query. There was no way to request more results. If you didn’t find what you were looking for, you would have to tweak the query. In Grafana 8.0, we added pagination to logs, so you can click through to older or newer logs when you hit the line limit.
Learn more and get started with logs
- Join us June 17 at 9:00 PT, 12:00 ET, 16:00 UTC for the Get more and spend less with Grafana Loki for logs session to see a demo and learn more about logging with Grafana Loki.
- Sign up for a Grafana Cloud account to quickly get started with Grafana Cloud Logs.
Grafana Machine Learning
During the session on The future of machine learning at Grafana Labs, we announced an early access program for Grafana Machine Learning. This new offering gives Grafana Cloud users the ability to create advanced predictions and adaptive alerts, automate root cause analysis, and ultimately gain a better understanding of their systems.
Compared to other AI and machine learning solutions in the market today, Grafana Machine Learning doesn’t try to apply machine learning to every metric and then sift through it to extract “insights.” Instead, our focus is on building new tools to help users understand the key metrics that are important to them.
For those key metrics, we make it easy to configure time series prediction tasks using state-of-the-art machine learning models and automatically keep those models up to date with the latest data. With a stable of trained models, Grafana Machine Learning can then produce high-quality forecasts that tell us what “normal” is based on historical performance, and what we can expect in the future. And with that knowledge, we can create dynamic alerts that tell us when the real-world behavior is abnormal, without someone needing to check a dashboard or maintain static thresholds.

Learn more and sign up for early access here.

